Super-Earth exoplanet 55 Cancri e (secondary eclipse lightcurve)

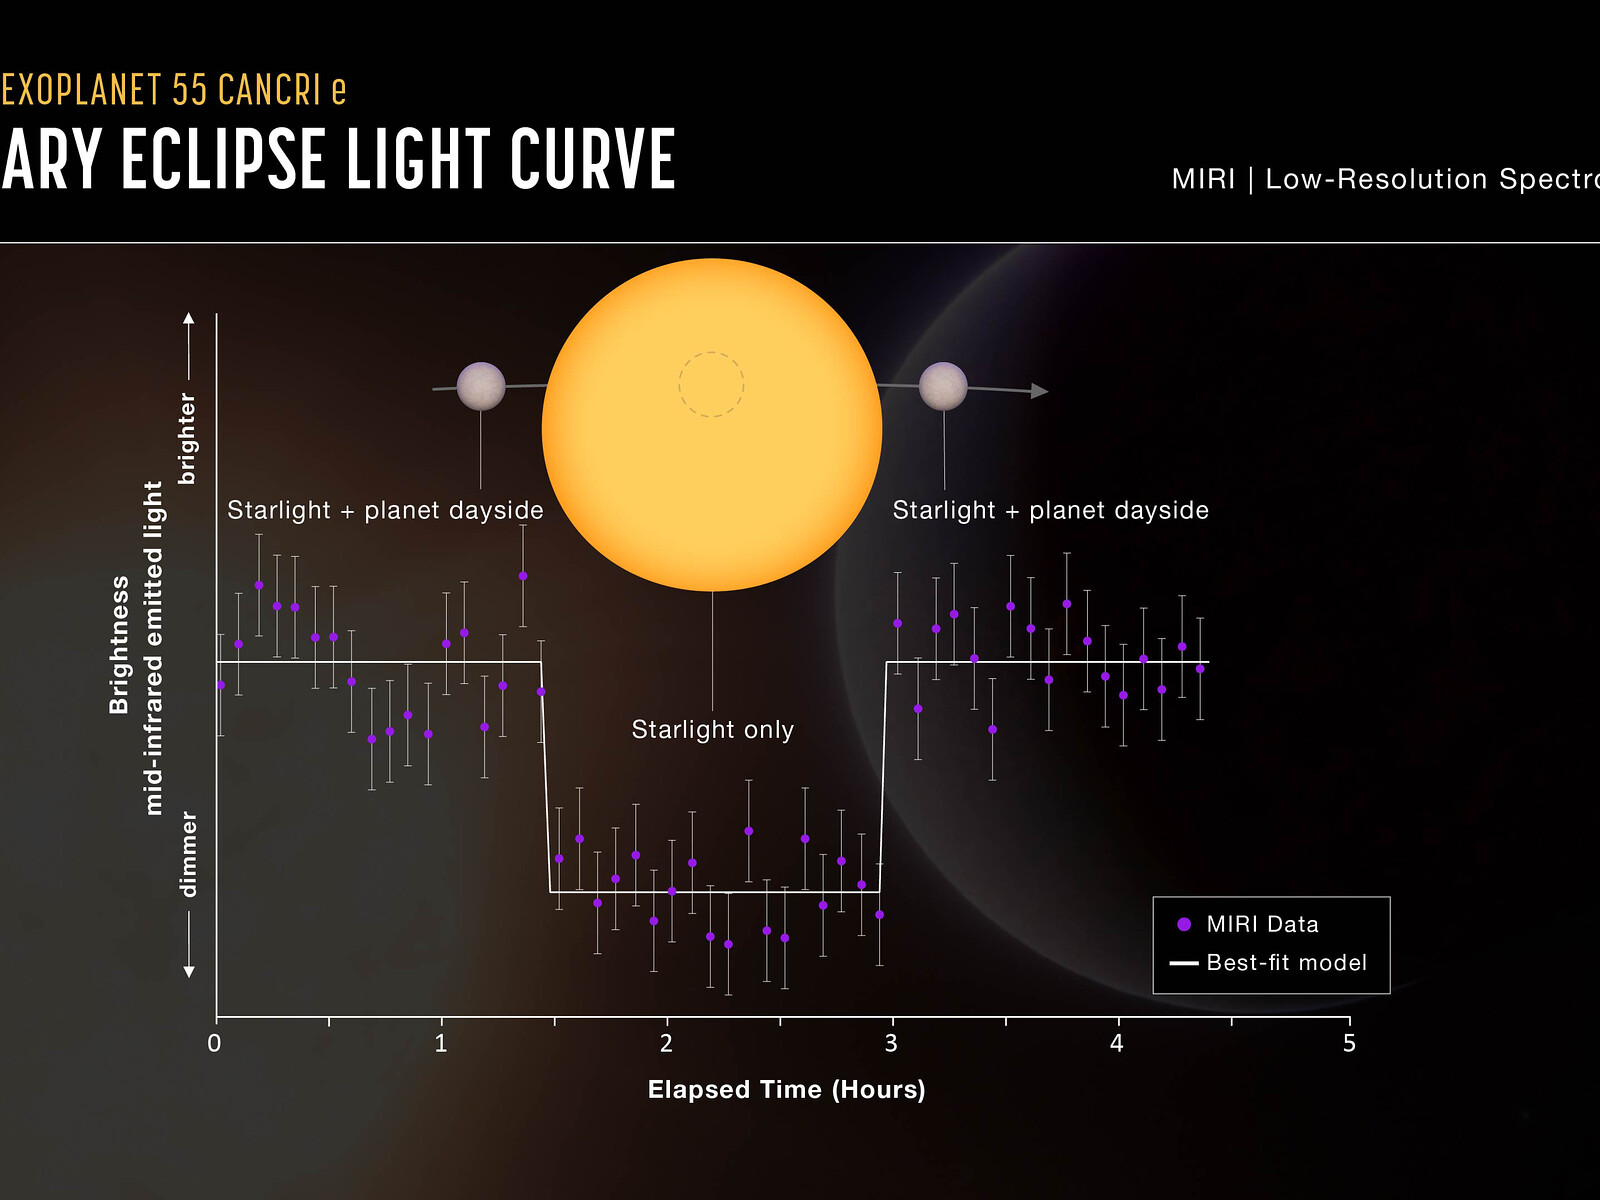
This lightcurve shows the change in brightness of the 55 Cancri system as the rocky planet 55 Cancri e, the closest of the five known planets in the system, moves behind the star. This phenomenon is known as a secondary eclipse.
When the planet is beside the star, the mid-infrared light emitted by both the star and the dayside of the planet reaches the telescope, and the system appears brighter. When the planet is behind the star, the light emitted by the planet is blocked and only the starlight reaches the telescope, causing the apparent brightness to decrease.
Astronomers can subtract the brightness of the star from the combined brightness of the star and planet to calculate how much infrared light is coming from the dayside of the planet. This is then used to calculate the dayside temperature and infer whether or not the planet has an atmosphere.
The graph shows data collected using the low-resolution spectroscopy mode on Webb’s Mid-Infrared Instrument (MIRI) in March 2023. Each of the purple data points shows the brightness of light ranging in wavelength from 7.5 to 11.8 microns, averaged over intervals of about five minutes. The grey line is the best fit, or model lightcurve that matches the data most closely. The decrease in brightness during the secondary eclipse is just 110 parts per million, or about 0.011 percent.
The temperature of the planet calculated from this observation is about 1800 kelvins (around 1500 degrees Celsius), which is significantly lower than would be expected if the planet has no atmosphere or only a thin rock-vapour atmosphere. This relatively low temperature indicates that heat is being distributed from the dayside to the nightside of the planet, possibly by a volatile-rich atmosphere.
[Image description: Diagram of a secondary eclipse and a graph of change in brightness over time. Below the diagram is a graph showing the change in brightness of mid-infrared light emitted by the star-planet system over the course of about four and a half hours. The infographic shows that the brightness of the system decreases as the planet moves behind the star.]
Credit:NASA, ESA, CSA, J. Olmsted (STScI), A. Bello-Arufe (JPL)
About the Image
| Id: | weic2412b | |
|---|---|---|
| Type: | Chart | |
| Release date: | 8 May 2024, 17:00 | |
| Related releases: | weic2412 | |
| Size: | 3840 x 2160 px | |