Super-Earth exoplanet 55 Cancri e (emission spectrum)

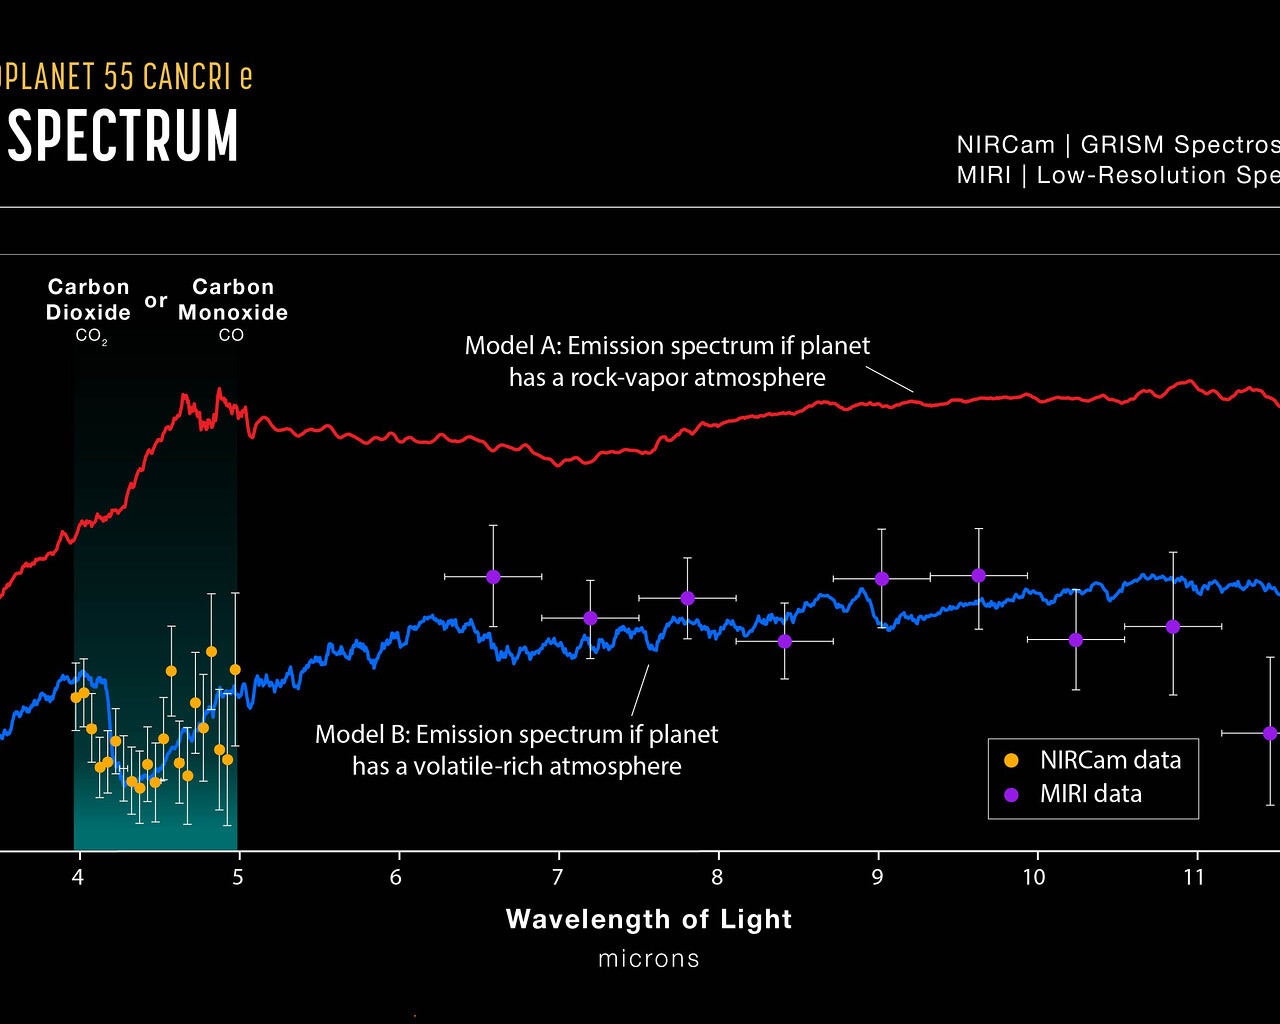
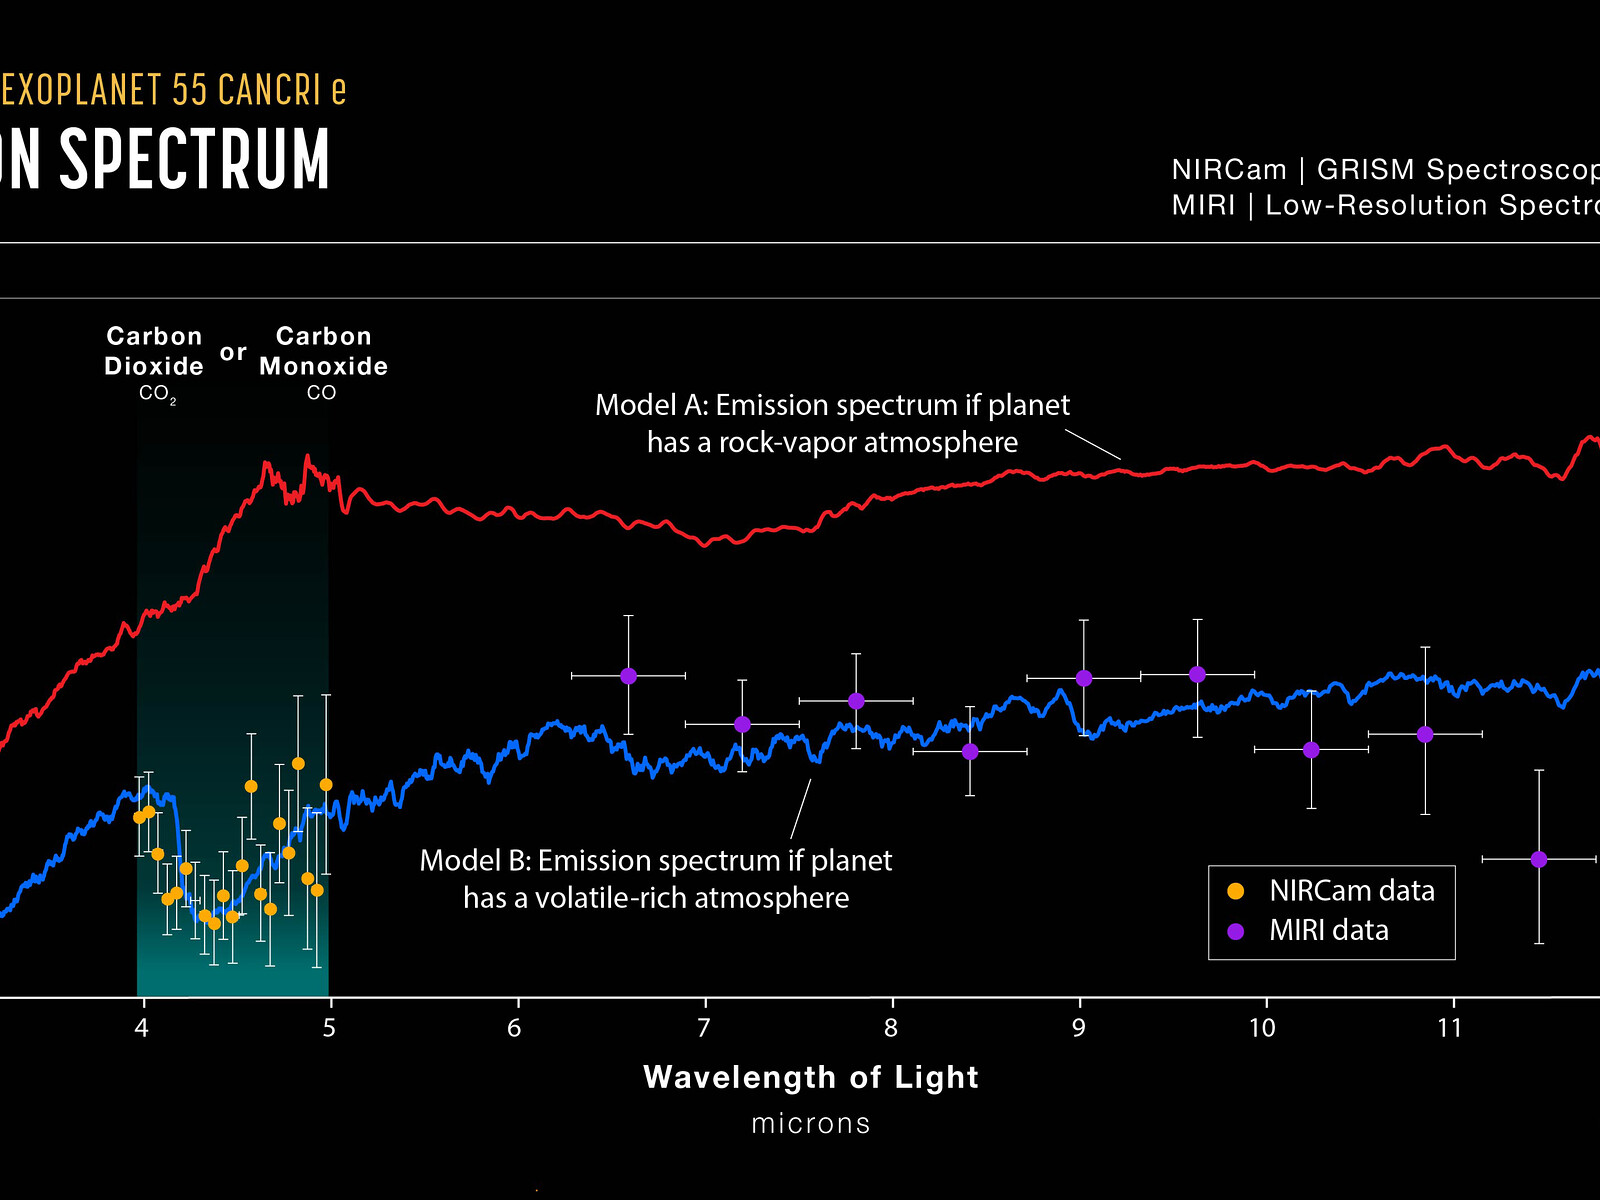
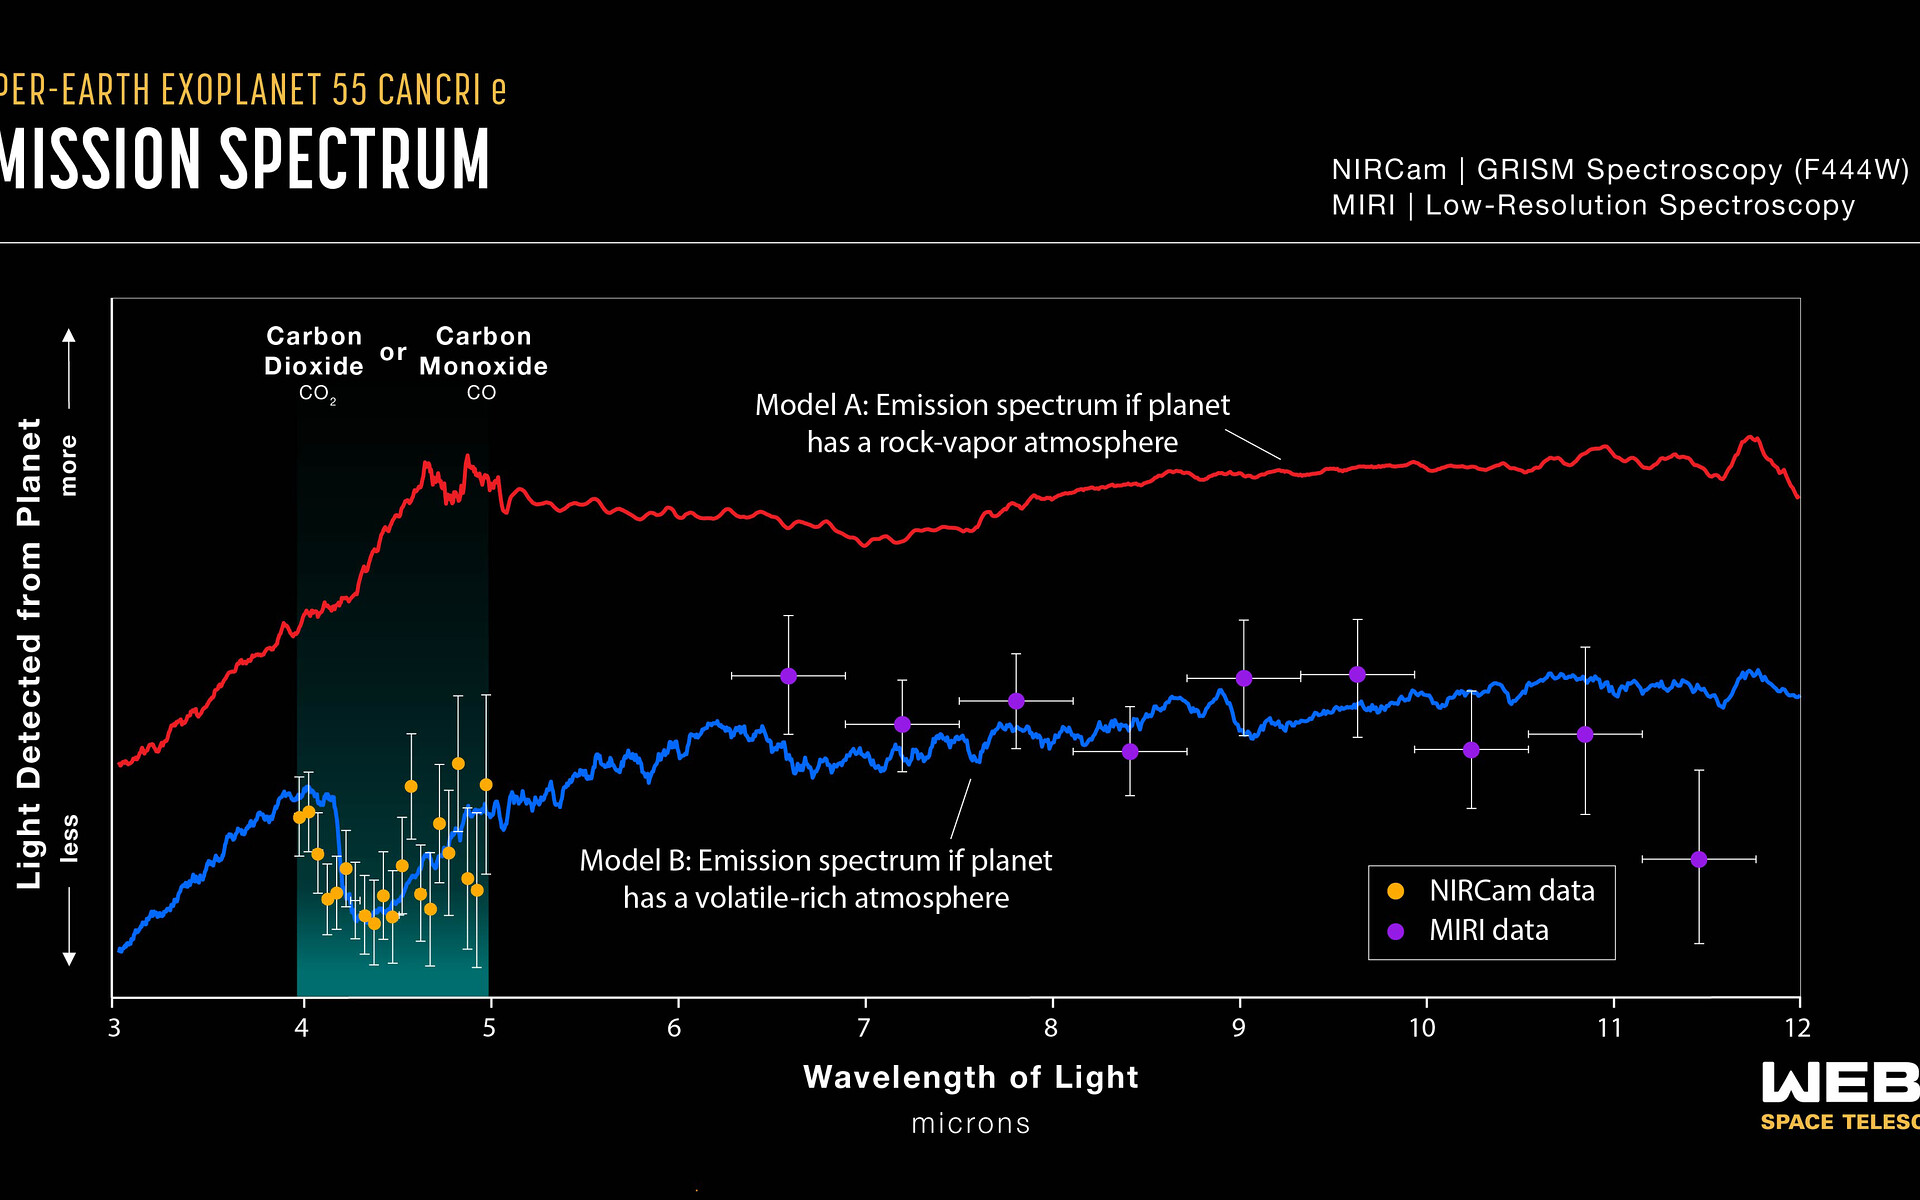
A thermal emission spectrum captured by Webb’s NIRCam (Near-Infrared Camera) in November 2022, and MIRI (Mid-Infrared Instrument) in March 2023, shows the brightness (y-axis) of different wavelengths of infrared light (x-axis) emitted by the super-Earth exoplanet 55 Cancri e. The spectrum shows that the planet may be surrounded by an atmosphere rich in carbon dioxide or carbon monoxide and other volatiles, not just vaporised rock.
The graph compares data collected by NIRCam (orange dots) and MIRI (purple dots) to two different models. Model A, in red, shows what the emission spectrum of 55 Cancri e should look like if it has an atmosphere made of vaporised rock. Model B, in blue, shows what the emission spectrum should look like if the planet has a volatile-rich atmosphere outgassed from a magma ocean that has a volatile content similar to Earth’s mantle. Both MIRI and NIRCam data are consistent with the volatile-rich model.
The amount of mid-infrared light emitted by the planet (MIRI) shows that its dayside temperature is significantly lower than it would be if it did not have an atmosphere to distribute heat from the dayside to the nightside. The dip in the spectrum between 4 and 5 microns (NIRCam data) can be explained by absorption of those wavelengths by carbon monoxide or carbon dioxide molecules in the atmosphere.
The spectrum was made by measuring the brightness of 4- to 5-micron light with Webb’s NIRCam GRISM spectrometer, and 5- to 12-micron light with the MIRI low-resolution spectrometer, before, during and after the planet moved behind its star (the secondary eclipse ). The amount of each wavelength emitted by the planet (y-axis) was calculated by subtracting the brightness of the star alone (during the secondary eclipse) from the brightness of the star and planet combined (before and after the eclipse). Each observation lasted about eight hours.
Note that the NIRCam data have been shifted vertically to align with Model B. Although the differences in brightness between each wavelength in the NIRCam band were derived from the observation (the data suggest a valley between 4 and 5 microns), the absolute brightness (the vertical position of that valley) could not be measured precisely because of noise in the data.
[Image description: Graph showing the brightness of light captured by Webb’s NIRCam and MIRI instruments plotted alongside two different model emission spectra, and an illustration of the planet and its star in the background.]
Credit:NASA, ESA, CSA, J. Olmsted (STScI), R. Hu (JPL), A. Bello-Arufe (JPL), M. Zhang (University of Chicago), M. Zilinskas (SRON Netherlands Institute for Space Research)
About the Image
| Id: | weic2412c | |
|---|---|---|
| Type: | Chart | |
| Release date: | 8 May 2024, 17:00 | |
| Related releases: | weic2412 | |
| Size: | 3840 x 2160 px | |