Cosmic Evolution Early Release Science (CEERS) survey (NIRCam compass image)
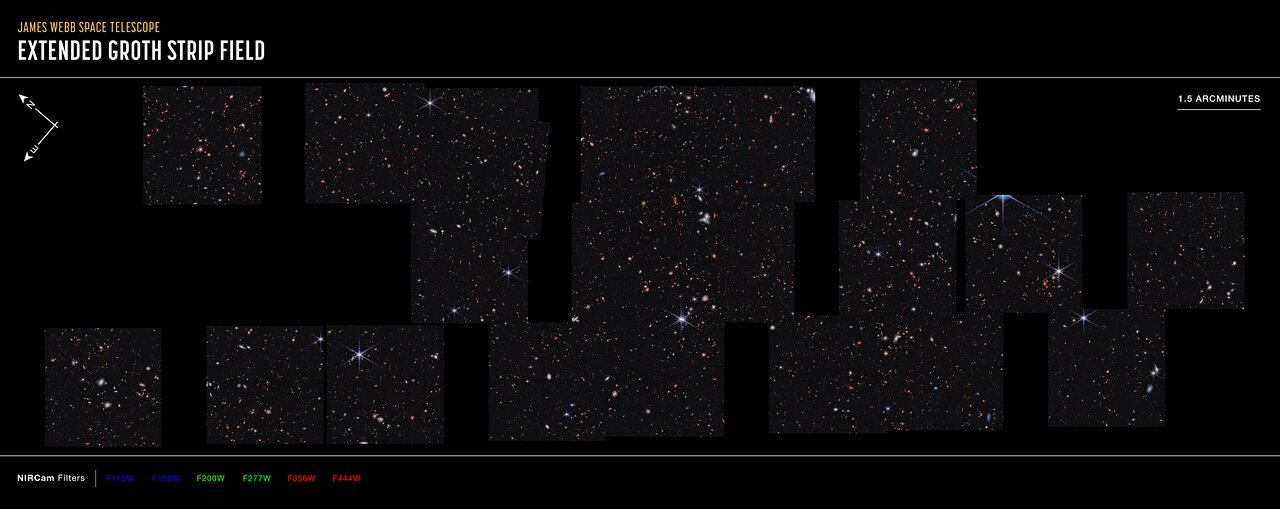
This image was stitched together from multiple images captured by the NASA/ESA/CSA James Webb Space Telescope in near-infrared light.
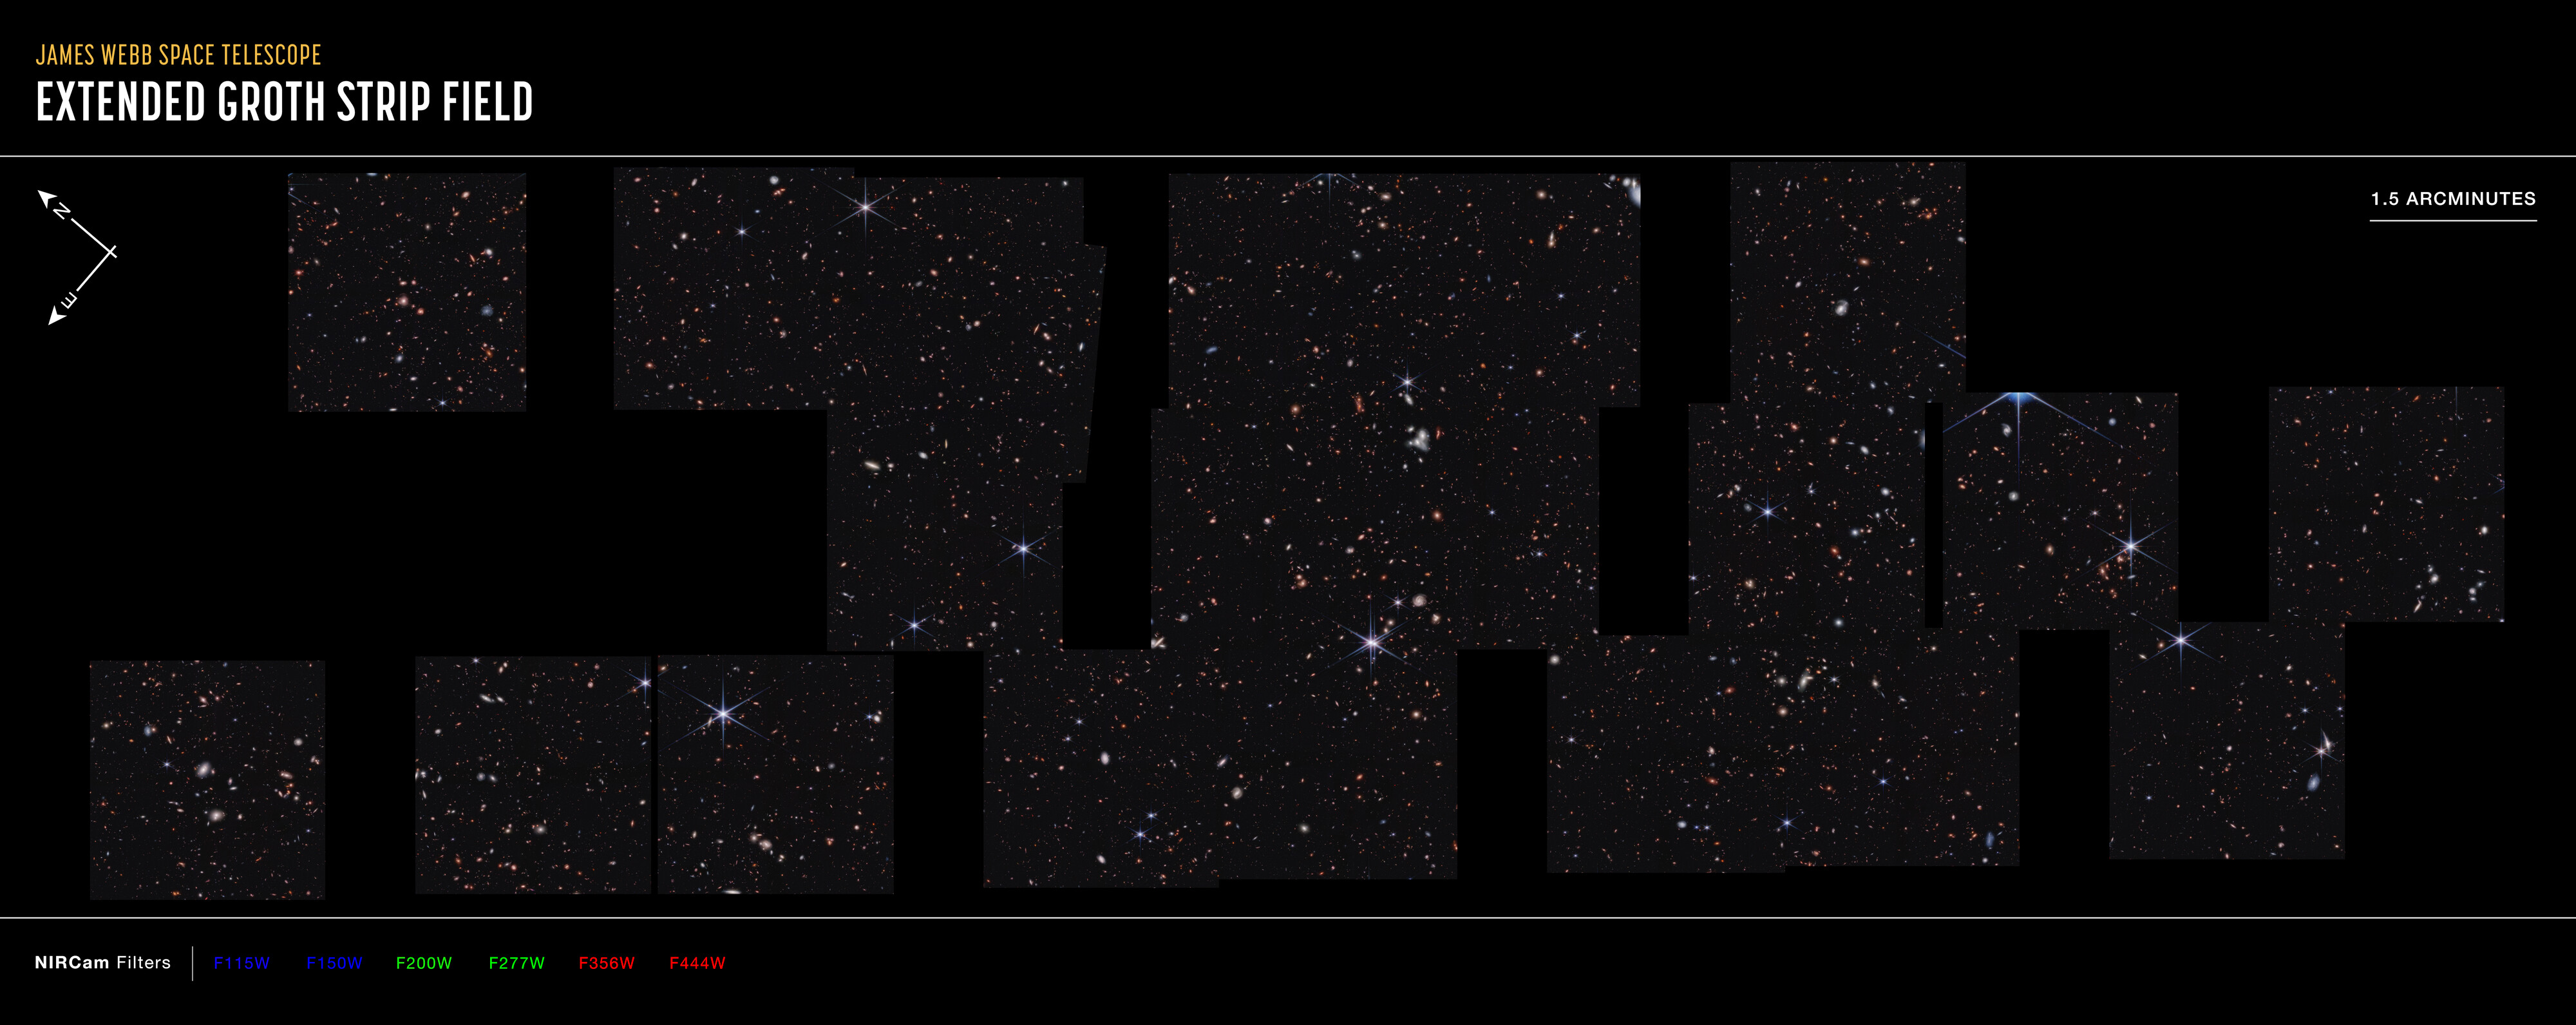
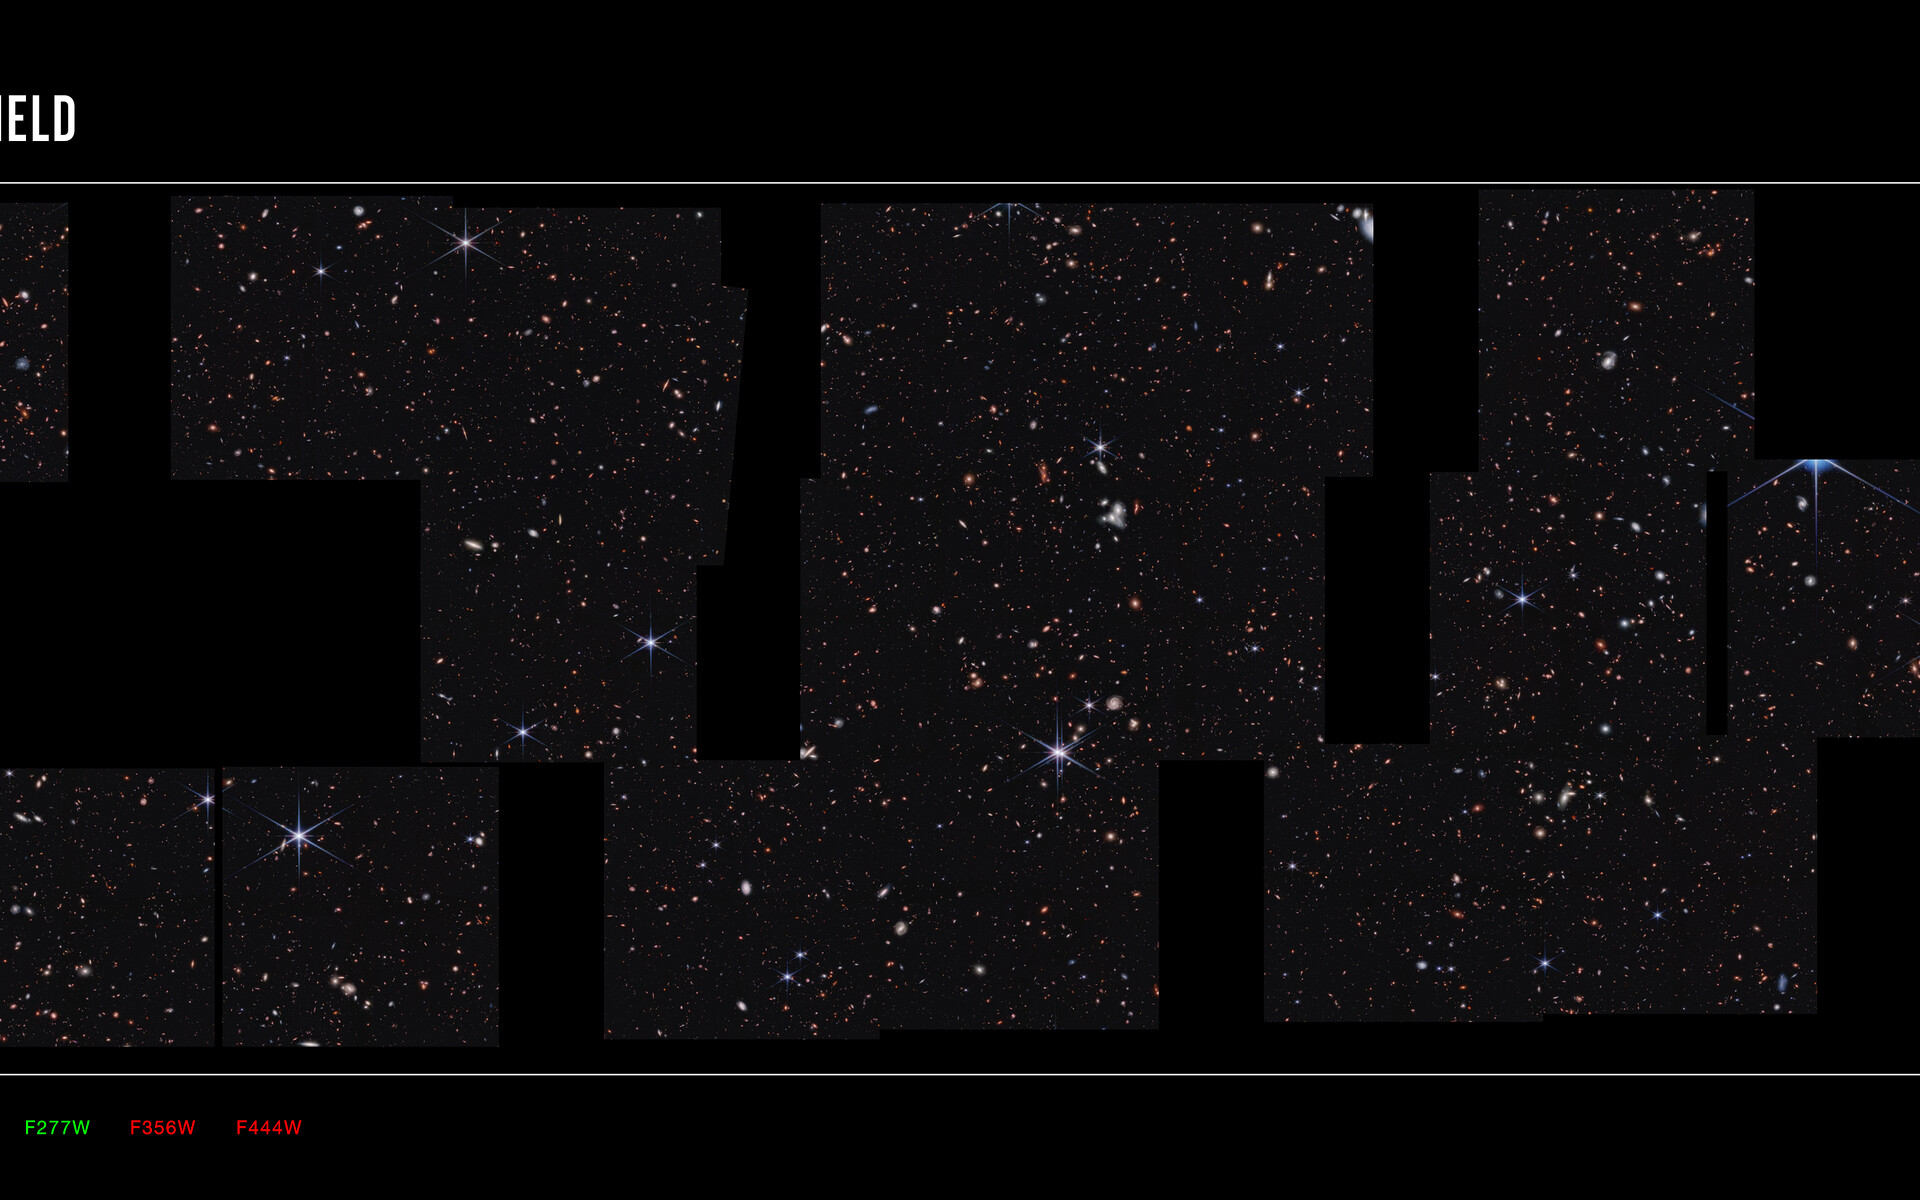
To the right of centre is a clump of bright white spiral galaxies that seem to be twisting into one another. Threaded throughout the scene are light pink spirals that look like pinwheels twirling in the wind. The bright foreground stars, set off in blue, announce themselves with Webb’s prominent eight-pointed diffraction spikes. In the bottom row, find the square second from far right. At its right edge, a misshapen blue galaxy is outfitted in blue-and-pink sparkling star clusters.
There is so much detail to explore in this panoramic vista, known as the Cosmic Evolution Early Release Science (CEERS) Survey. The galaxies that first caught the eyes of the researchers are those that haven’t appeared in any other images – Webb was the first to reveal their presence.
To find them, seek the tiniest, reddest dots speckled throughout this survey. The light from some of them has travelled for over 13 billion years to reach the telescope. The team followed up to obtain spectra with Webb, which led to the discovery of the most distant active supermassive black hole currently known, along with two more extremely distant active supermassive black holes that existed when the Universe was only 1 billion years old. The additional studies also confirmed that eleven galaxies existed when the universe was only 470 to 675 million years old.
Webb spent under an hour capturing each image in this field. Combined, they show off about 100,000 galaxies.
The CEERS Survey has already proven to researchers that Webb will help us learn an incredible amount about the early Universe.
The north and east compass arrows show the orientation of the image on the sky. Note that the relationship between north and east on the sky (as seen from below) is flipped relative to direction arrows on a map of the ground (as seen from above). This image shows invisible near-infrared wavelengths of light that have been translated into visible-light colours. The colour key shows which NIRCam filters were used when collecting the light. The colour of each filter name is the visible light colour used to represent the infrared light that passes through that filter. The scale bar is labelled in arcminutes, which is a measure of angular distance on the sky. One arcminute is equal to an angular measurement equal to 1/60 of one degree. (The full Moon has an angular diameter of about 30 arcminutes.) The actual size of an object that covers one arcminute on the sky depends on its distance from the telescope.
[Image description: Thousands of galaxies appear in this view, which is set against the black background of space. There are many overlapping objects at various distances. They include large, blue foreground stars, some with eight diffraction spikes, and white and pink spiral and elliptical galaxies. Numerous tiny red dots appear throughout the scene.]
Credit:NASA, ESA, CSA, S. Finkelstein (UT Austin), M. Bagley (UT Austin), R. Larson (UT Austin), A. Pagan (STScI)
About the Image
| Id: | CEERS2 | |
|---|---|---|
| Type: | Chart | |
| Release date: | 6 July 2023, 16:00 | |
| Size: | 15000 x 5968 px | |