Super-Earth Exoplanet TOI-561 b (NIRSpec Emission Spectrum)

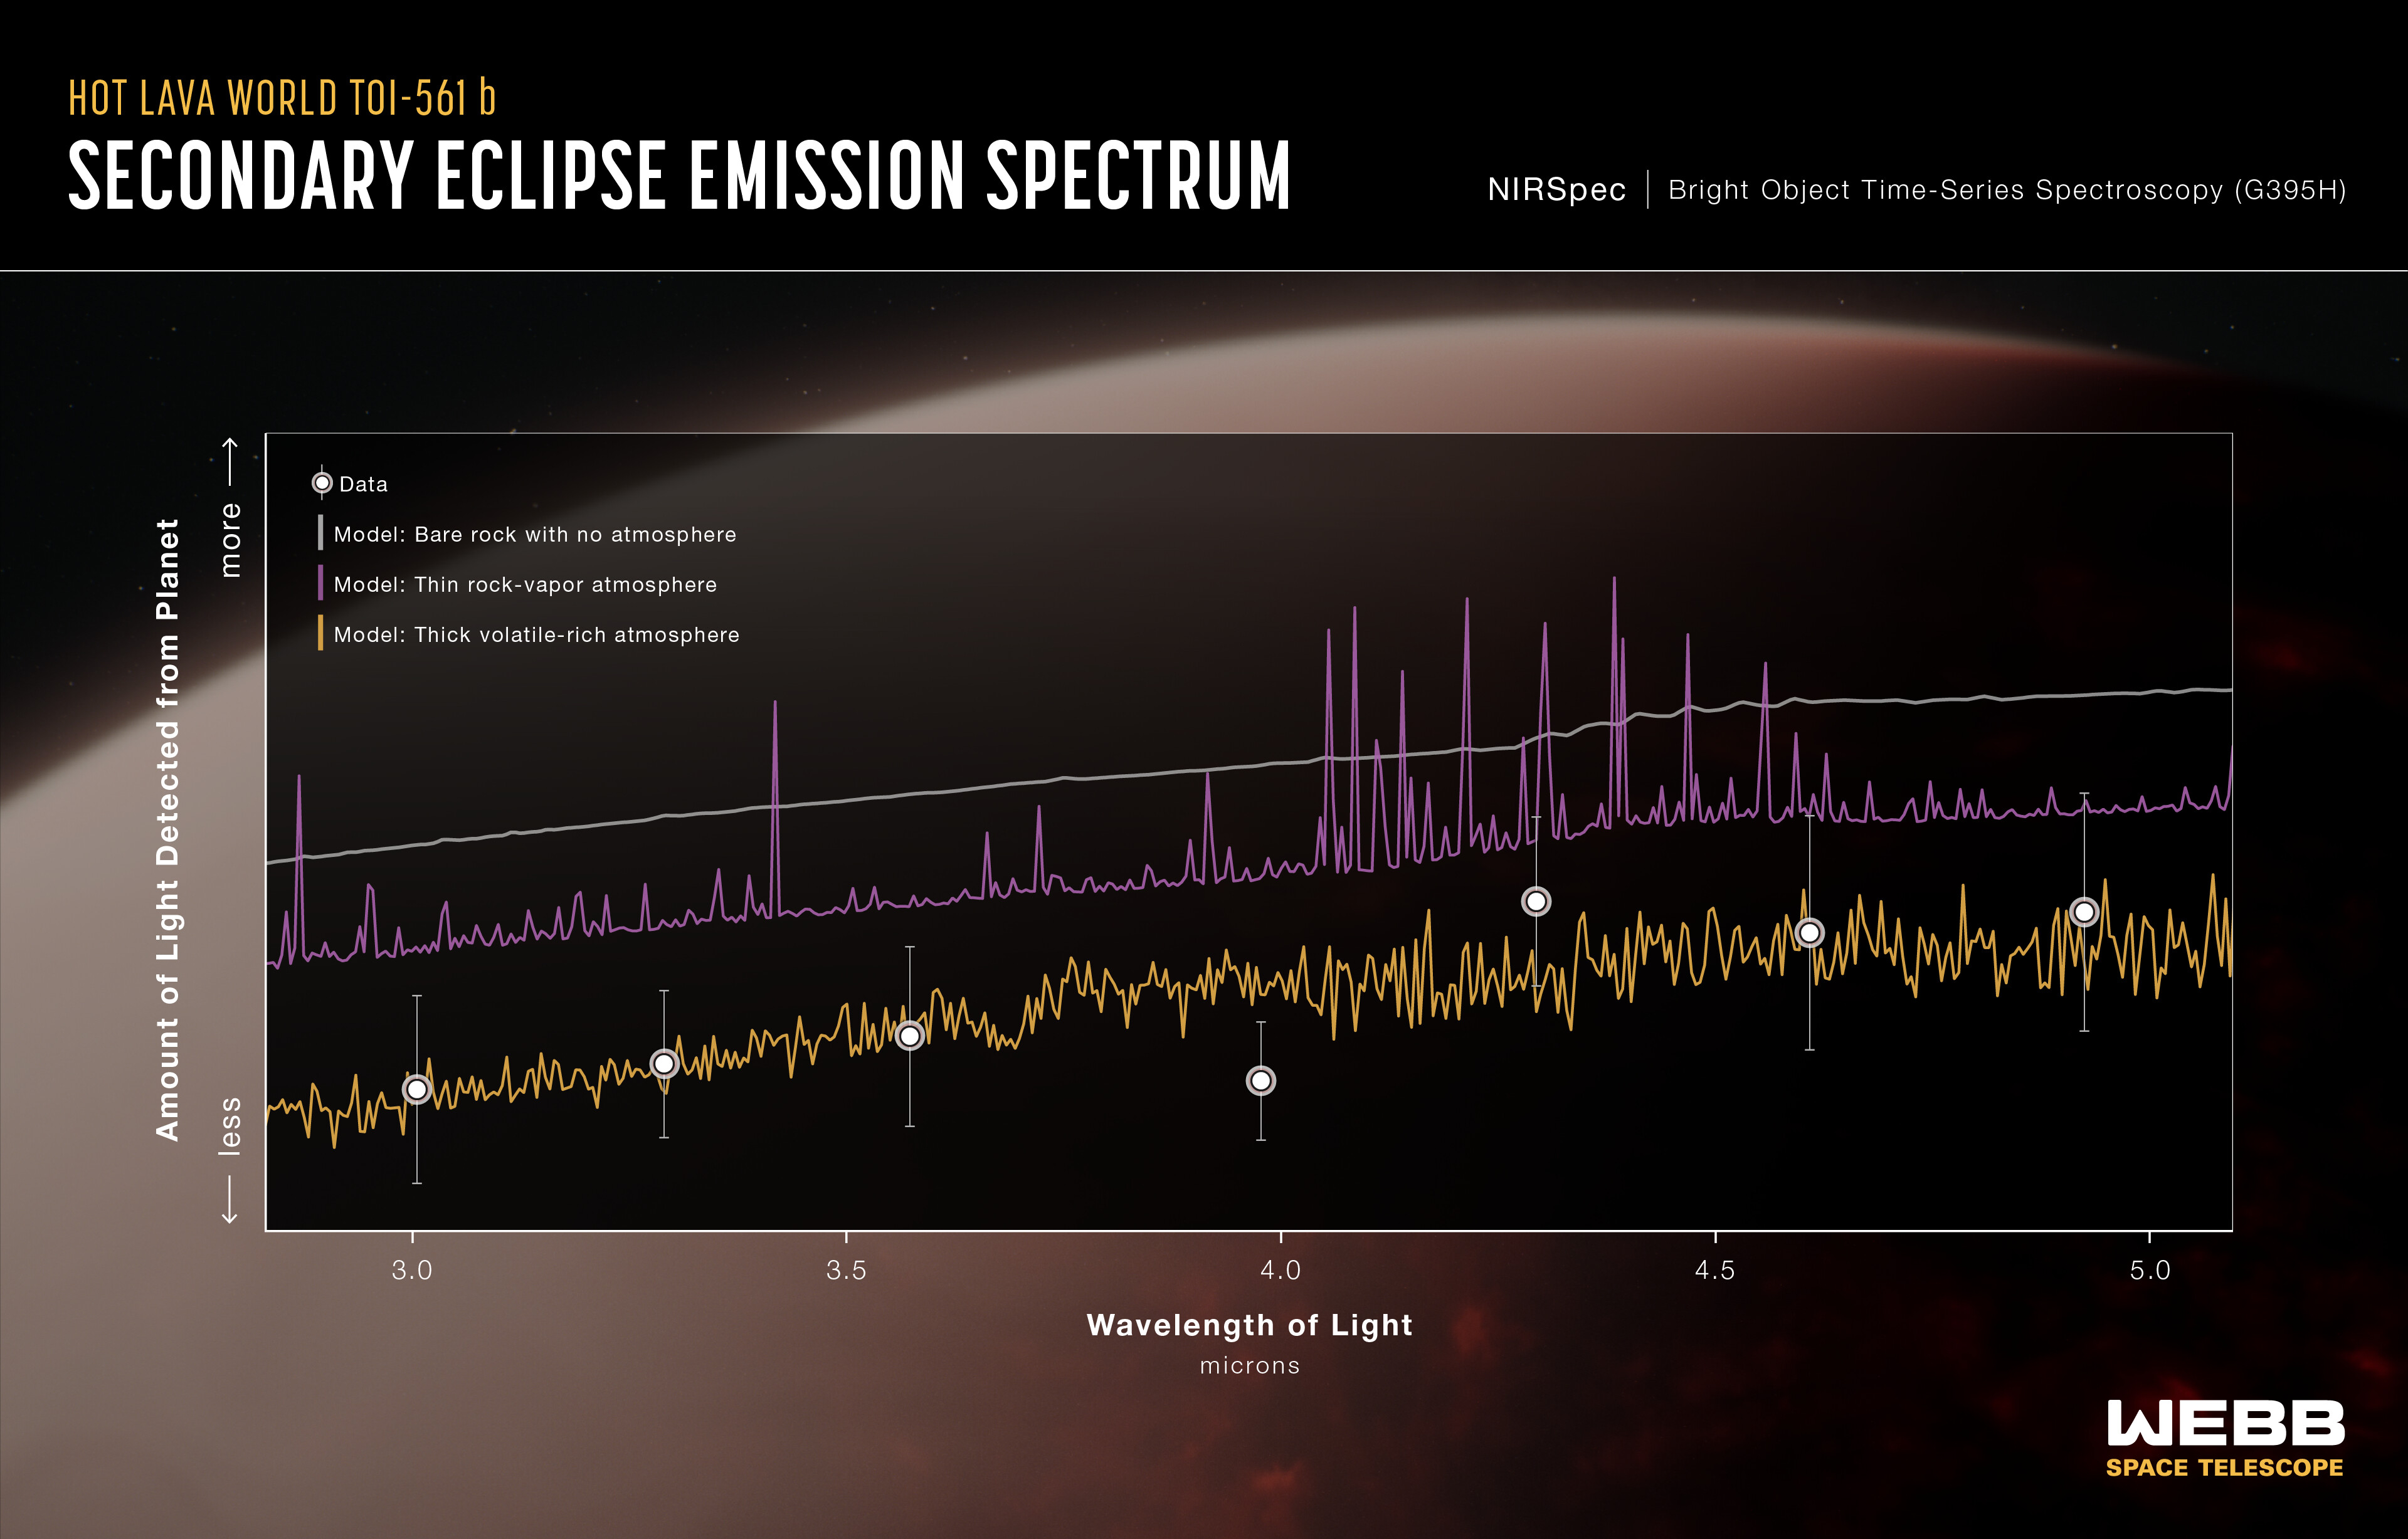
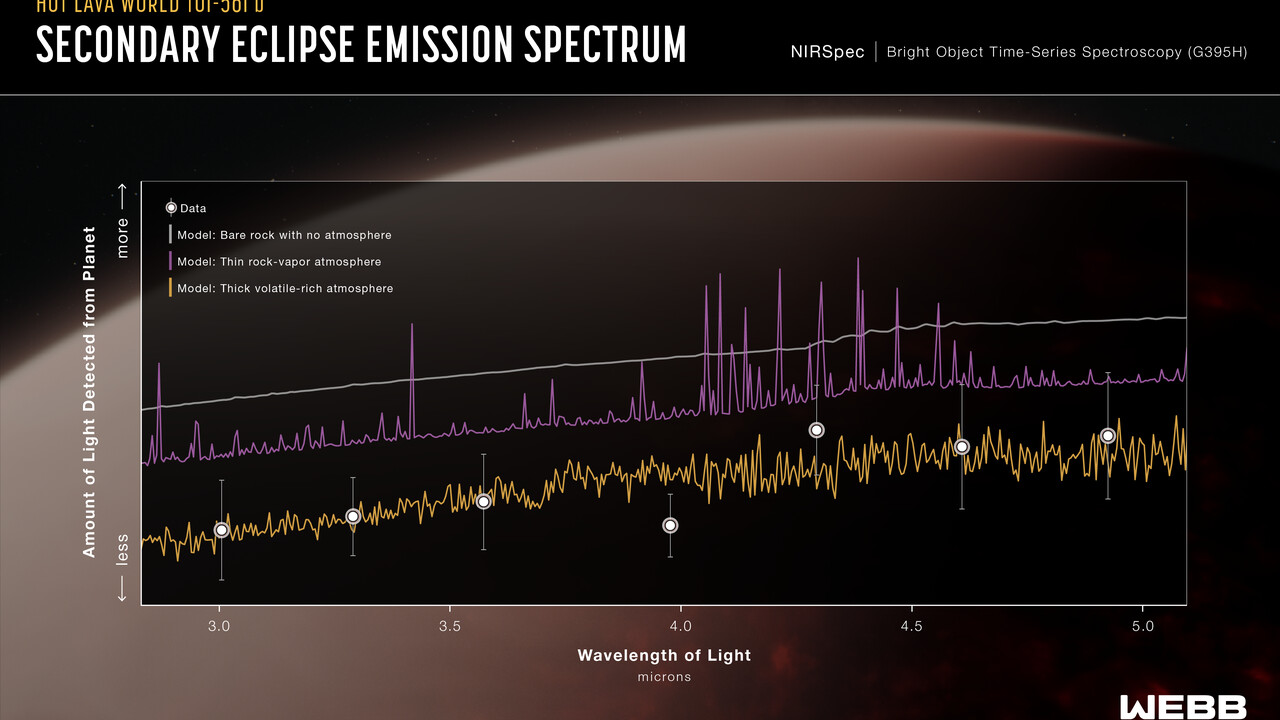
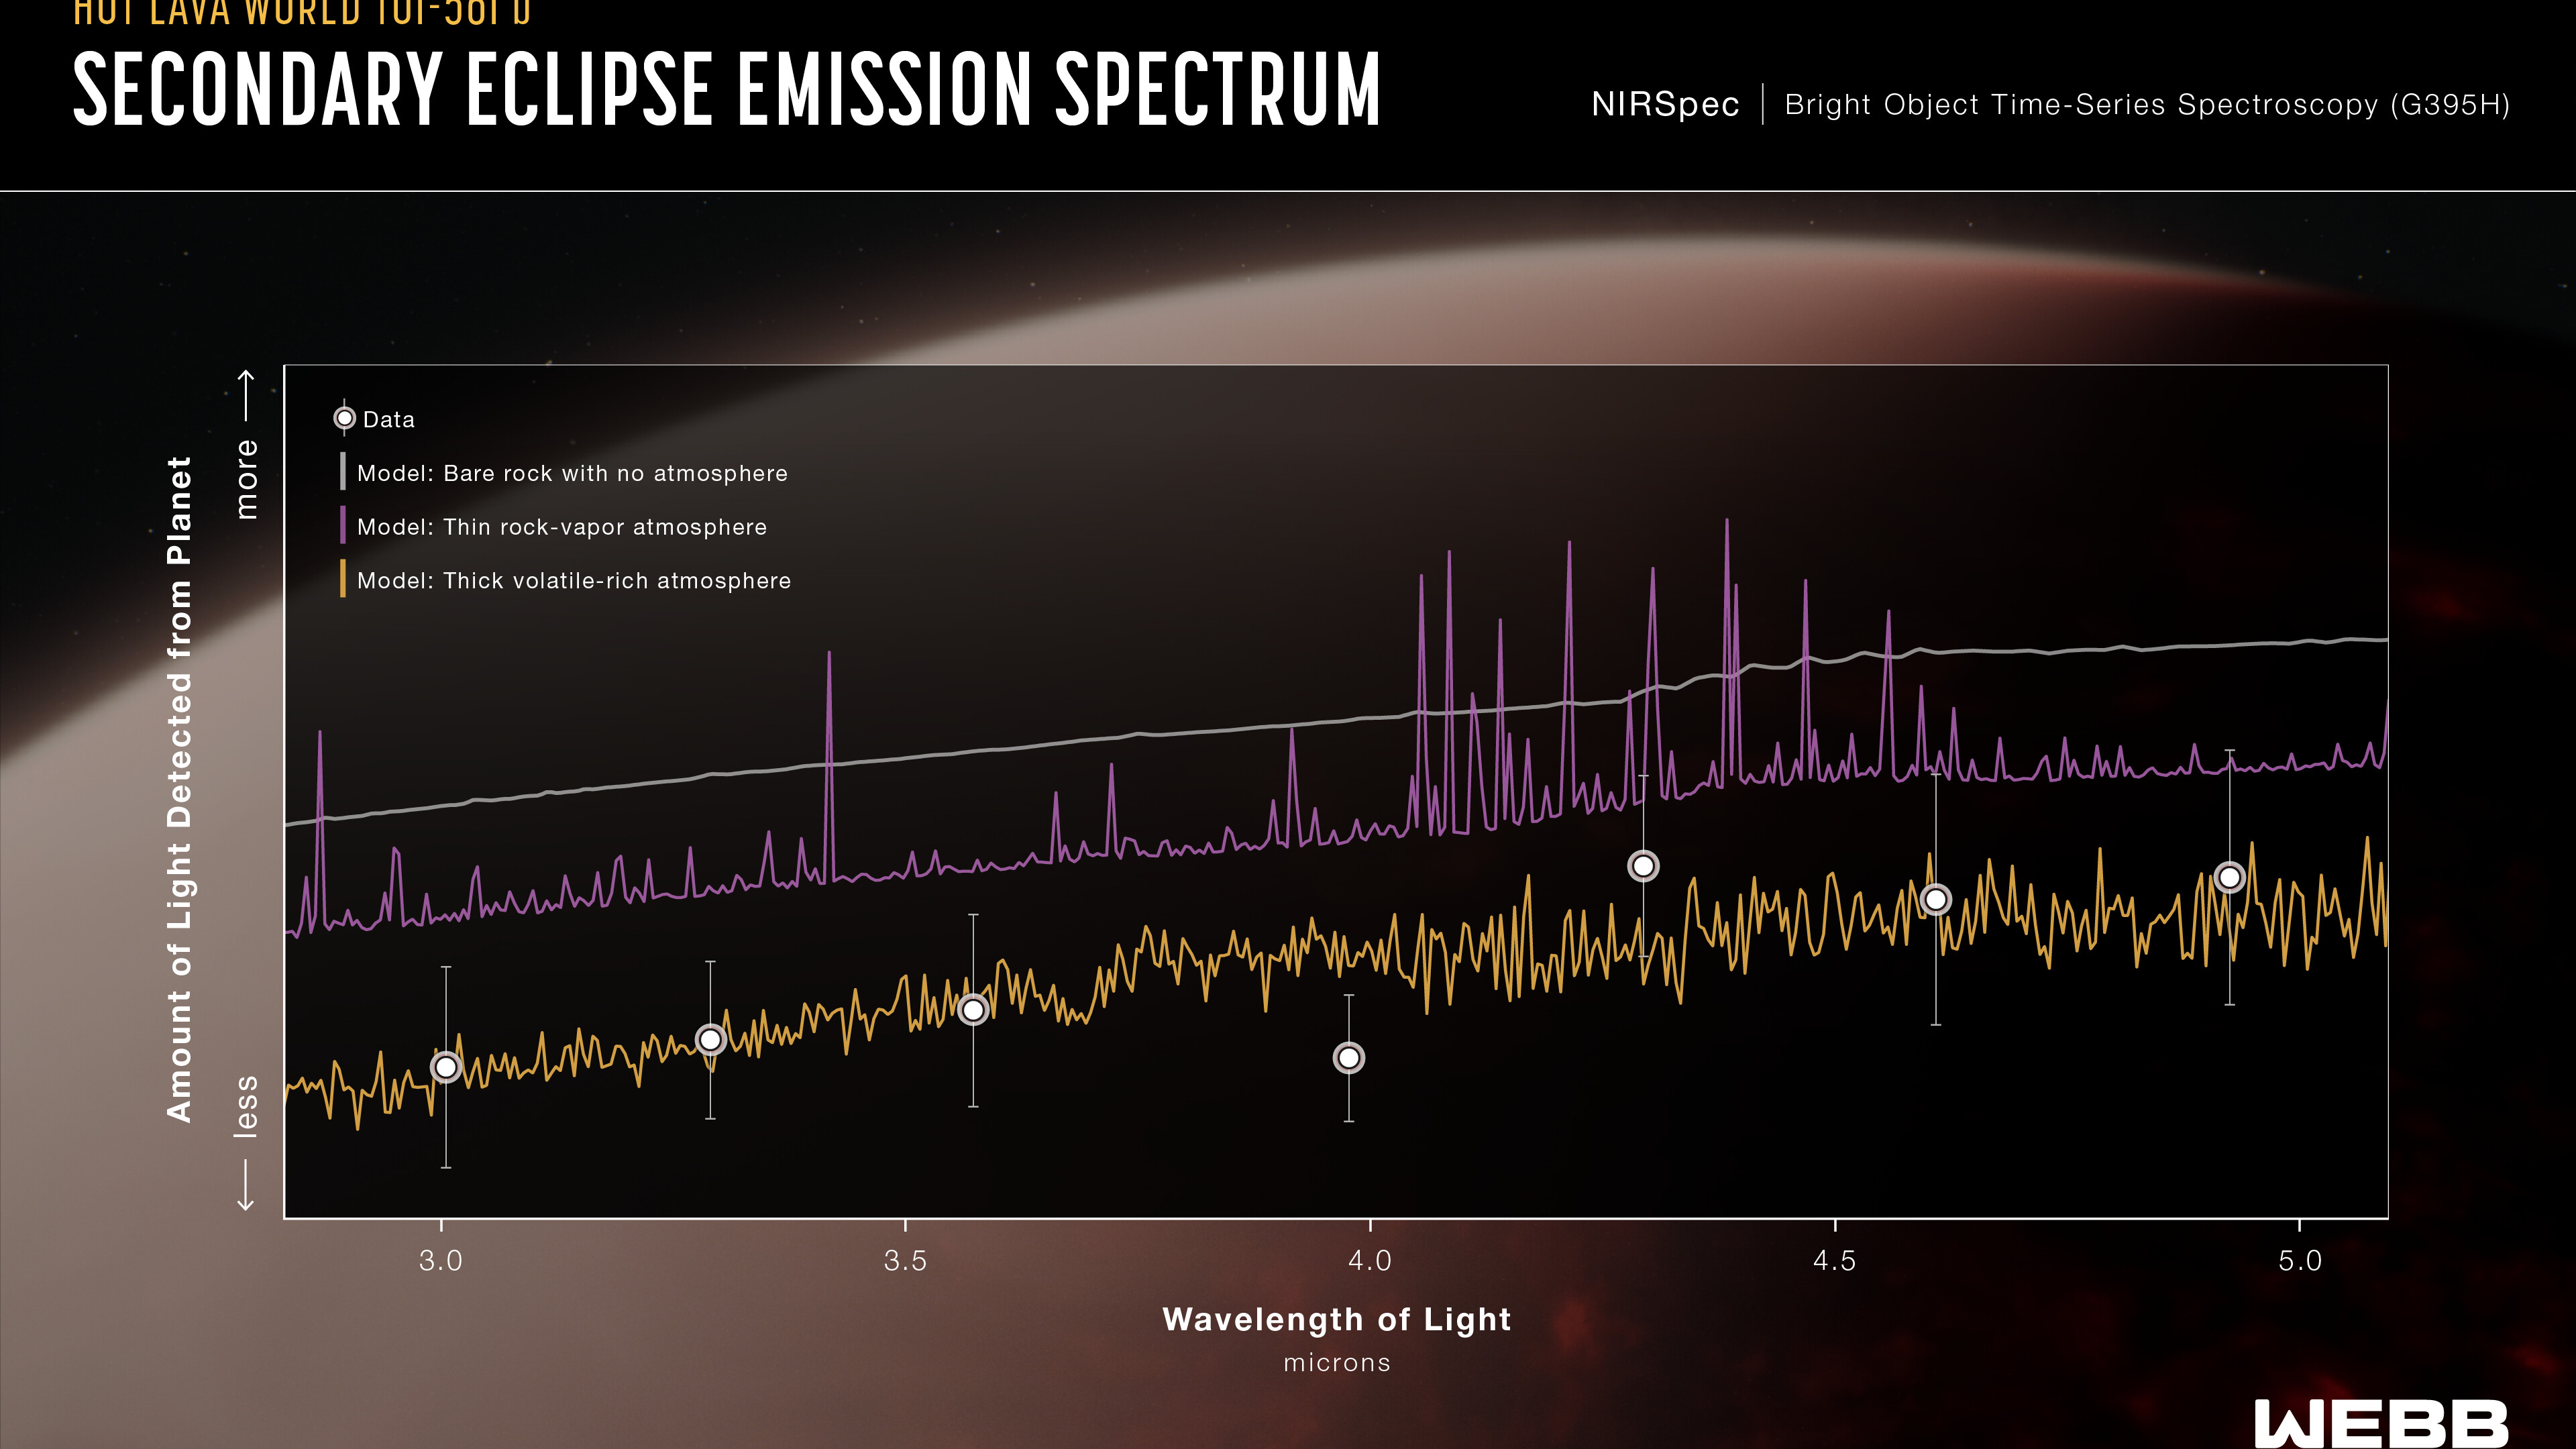
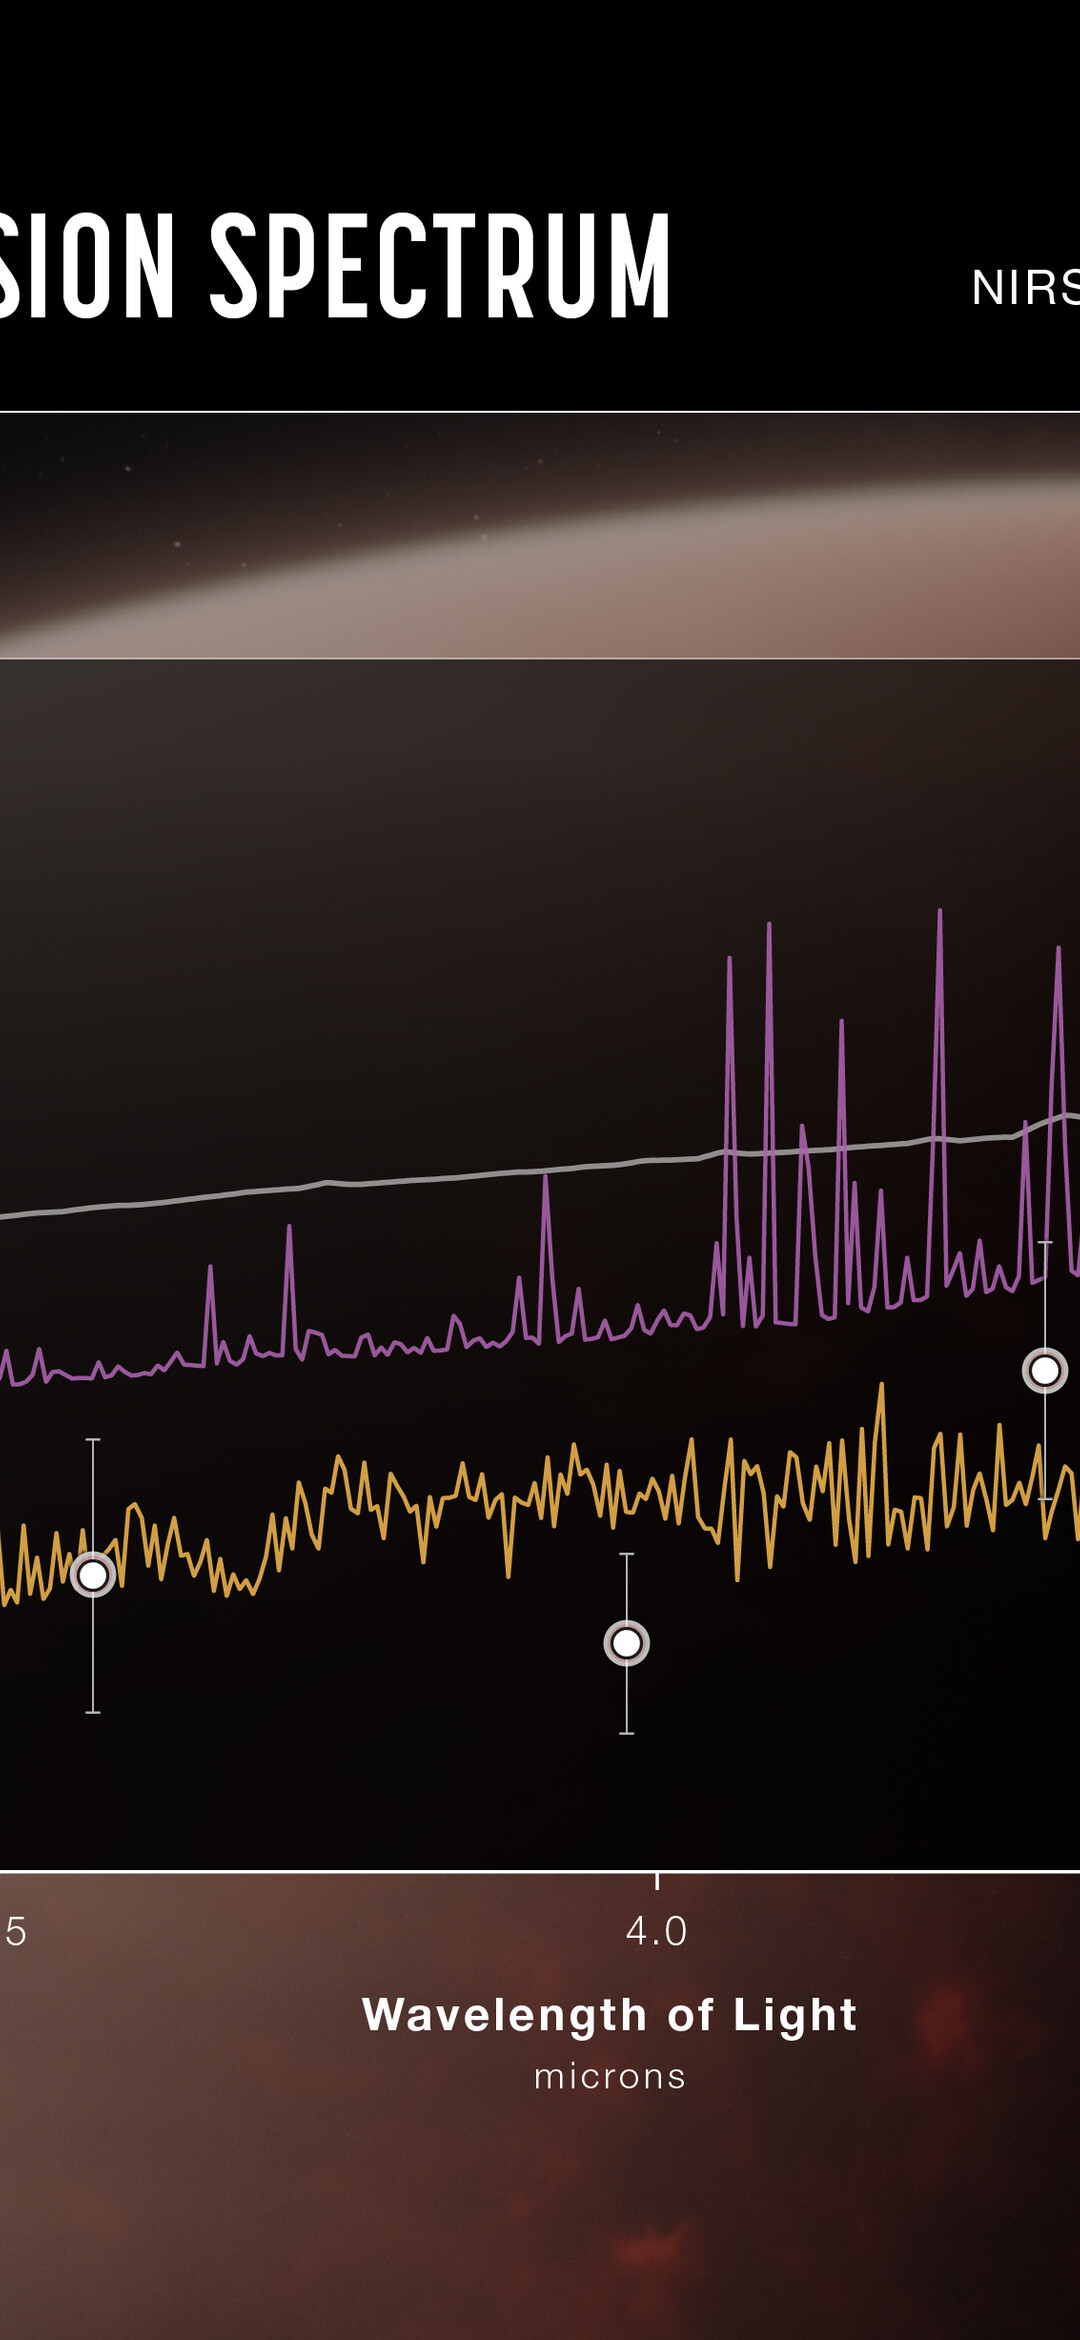
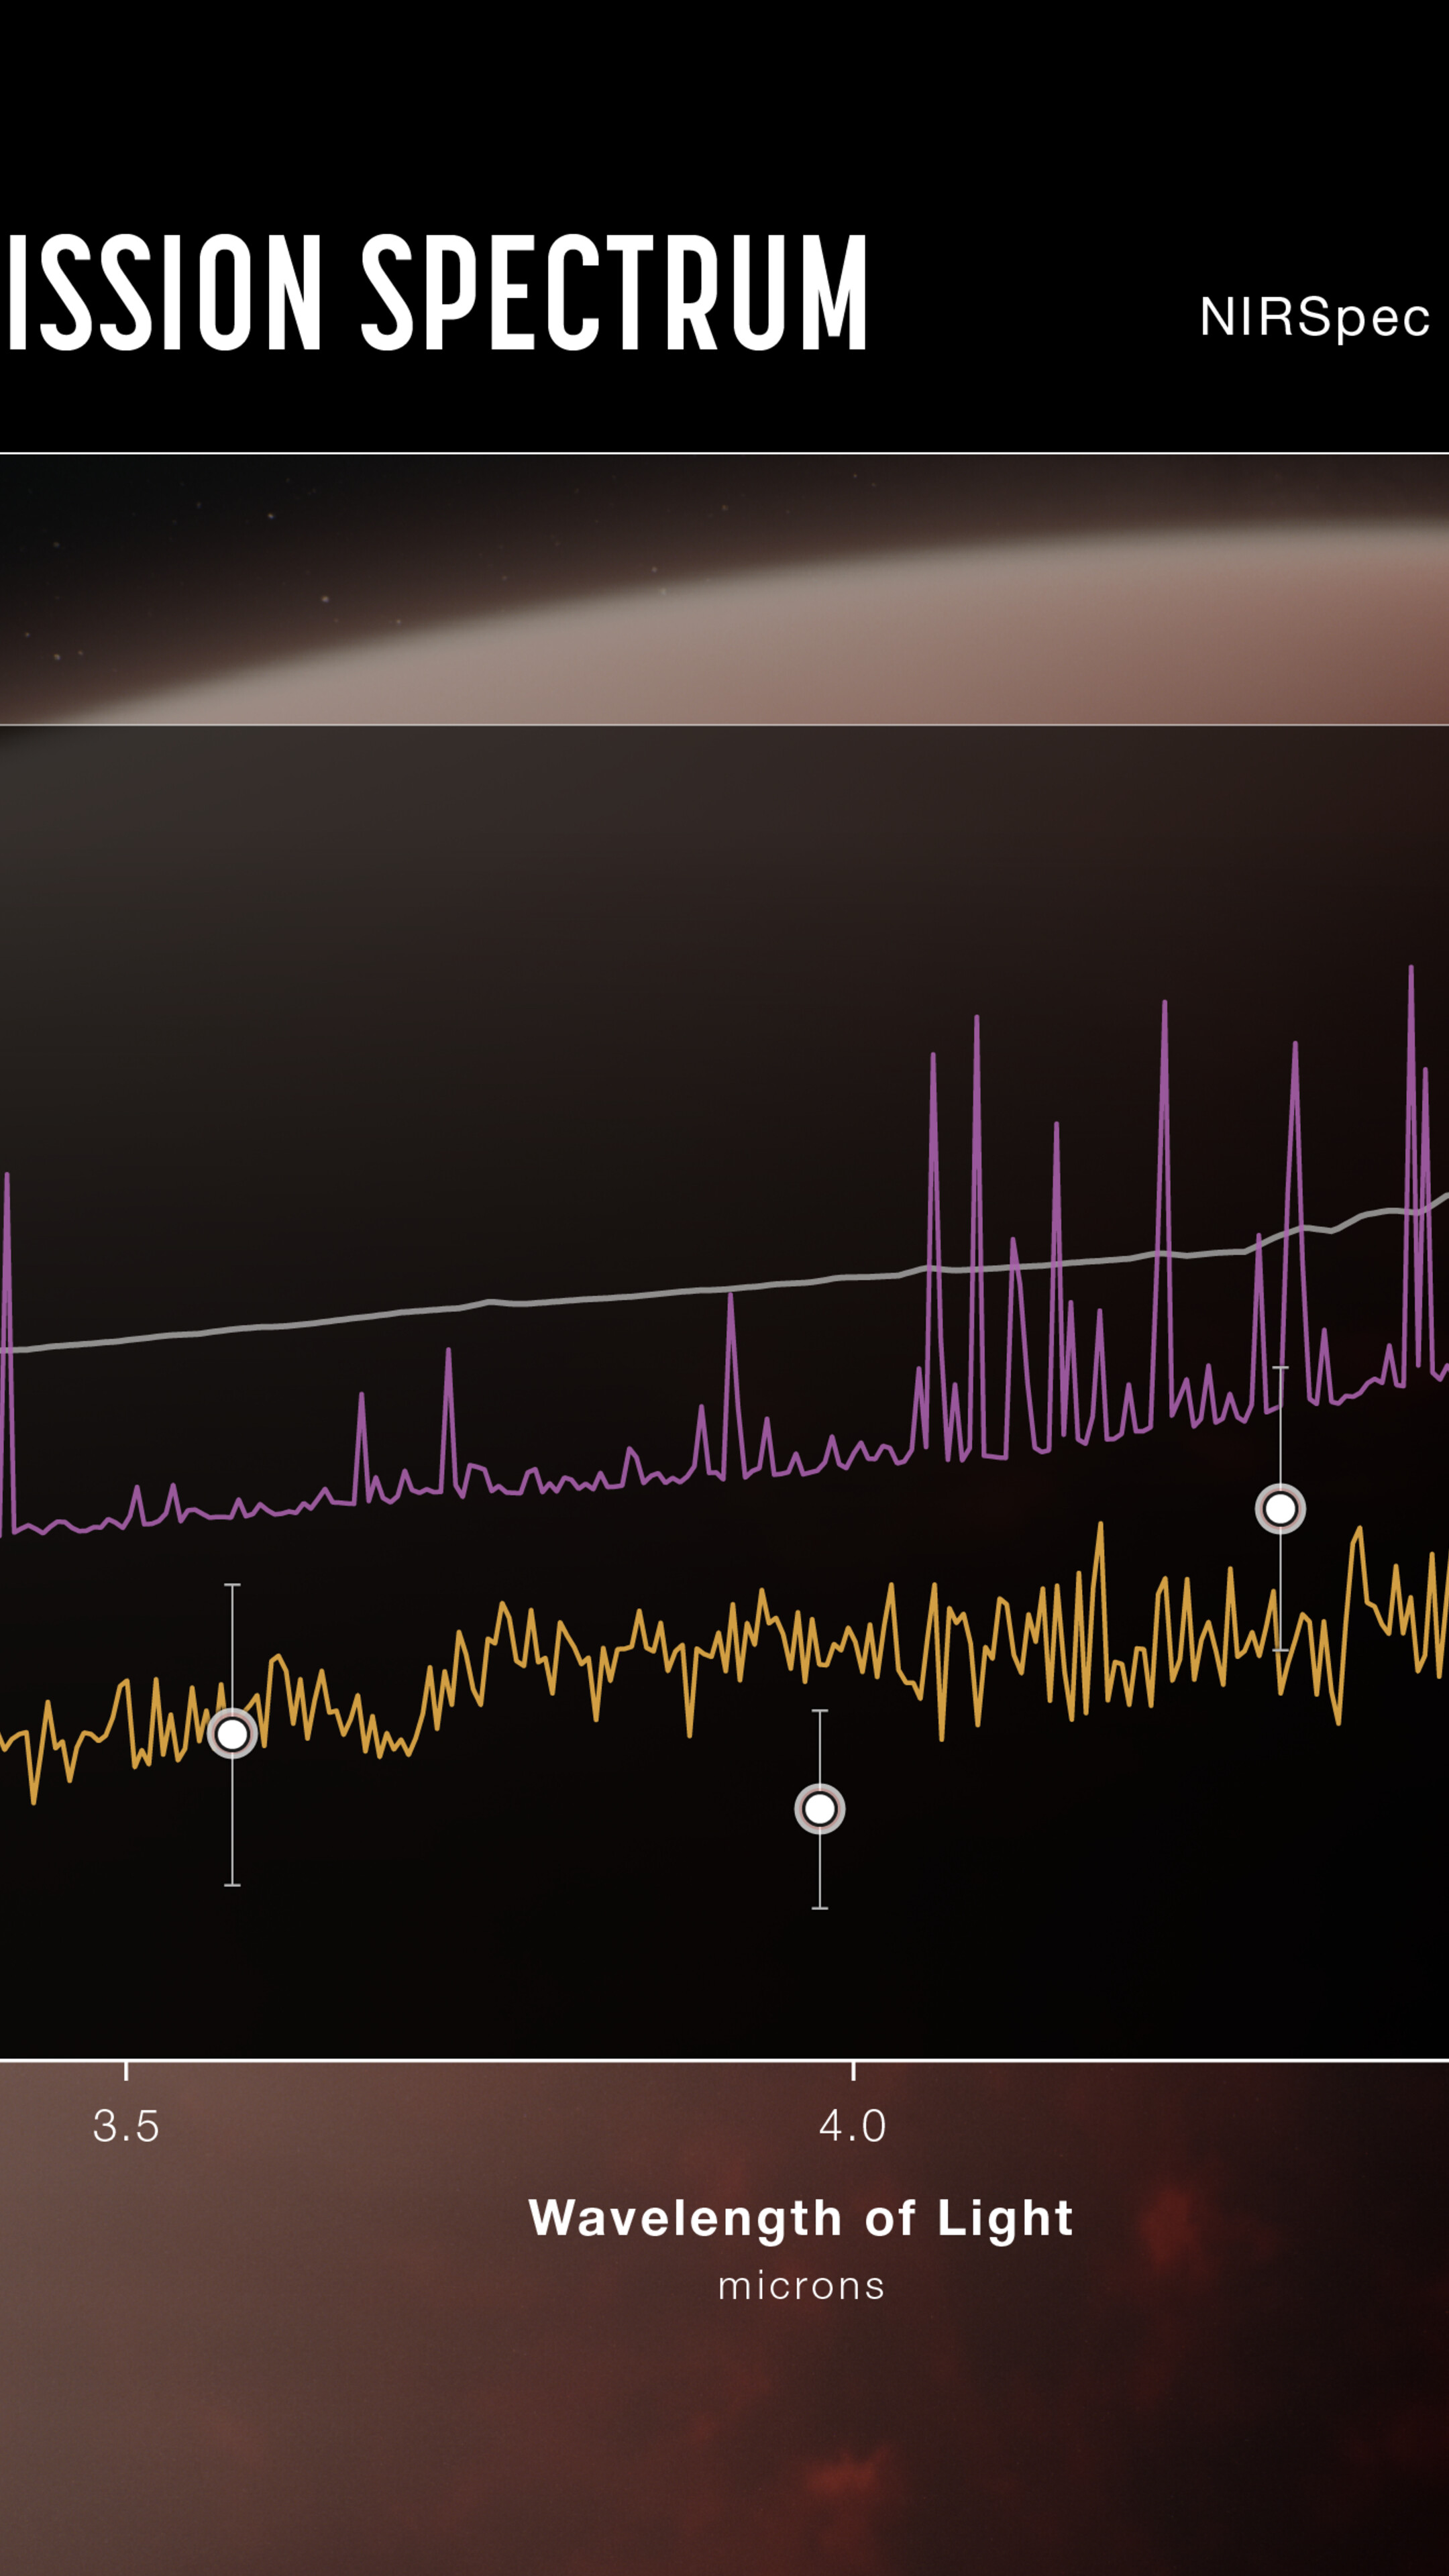
An emission spectrum captured by NIRSpec (the Near-Infrared Spectrograph) on the NASA/ESA/CSA James Webb Space Telescope in May 2024 shows the brightness of different wavelengths of 3- to 5-micron light coming from the ultra-hot super-Earth exoplanet TOI-561 b. Comparisons of the data to theoretical models suggest that the planet is not a bare rock, but is instead surrounded by a volatile-rich atmosphere.
The data (white circles) are based on measurements of the change in brightness of the star-planet system before, during, and after the secondary eclipse, when the planet moves behind the star. Although TOI-561 b is too close to the star to see on its own, the amount of light coming from the planet can be calculated by subtracting the brightness of the star (measured when the planet is behind the star) from the brightness of the planet and star combined (measured when the planet is beside the star). TOI-561 b is thought to be tidally locked, which means that most of the planetary light measured during this observation is coming from the dayside.
Three model spectra are shown for comparison. If TOI-561 b has a dark bare-rock surface with no atmosphere (smooth gray line), or a thin rock-vapour atmosphere (jagged purple line), the dayside of the planet should appear significantly brighter than it actually does. Instead, the data are much more consistent with an atmosphere rich in volatiles like water, oxygen, and carbon dioxide the model shown here assumes an atmosphere that is 100% water vapour).
A thick volatile-rich atmosphere absorbs some of the near-infrared light emitted by the surface, which reduces the amount that reaches the telescope. This makes the planet appear dimmer than it would with no atmosphere or a very thin layer or vapourized rock. A thick atmosphere also acts to distribute heat around the planet via winds, cooling the dayside and heating the nightside.
Webb observed the TOI-561 system continuously for more than 37 hours, capturing nearly four full orbits, including four consecutive secondary eclipses.
[Image description: This infographic shows a graph that depicts brightness versus wavelength ranging from 2.7 to 5.1 microns. Data points are plotted as white circles with error bars, along with three models: bare rock with no atmosphere (gray line), thin rock-vapour atmosphere (purple line), and thick volatile-rich atmosphere (yellow line). The gray bare-rock model is smooth and plots highest on the graph (most light detected). The purple rock-vapour model is jagged, with sharp peaks, some of which plot higher than the bare rock model. The yellow volatile-rich model plots lowest on the graph, with gentler peaks and valleys. The 7 data points closely follow the volatile-rich model: 5 lie directly on the line (3.0, 3.3, 3.6, 4.3, 4.9 microns), one (4.0) is slightly lower, and one (4.6) slightly higher. Background artwork shows a planet with a thick atmosphere over a partly molten surface.]
Credit:Illustration: NASA, ESA, CSA, Ralf Crawford (STScI), Science: J. Teske (Carnegie Science Earth and Planets Laboratory), A. Piette (University of Birmingham), T. Lichtenberg (Groningen), N. Wallack (Carnegie Science Earth and Planets Laboratory)
About the Image
| Id: | TOI-561b | |
|---|---|---|
| Type: | Chart | |
| Release date: | 11 December 2025, 16:00 | |
| Size: | 3840 x 2455 px | |