TRAPPIST-1 c emission spectra

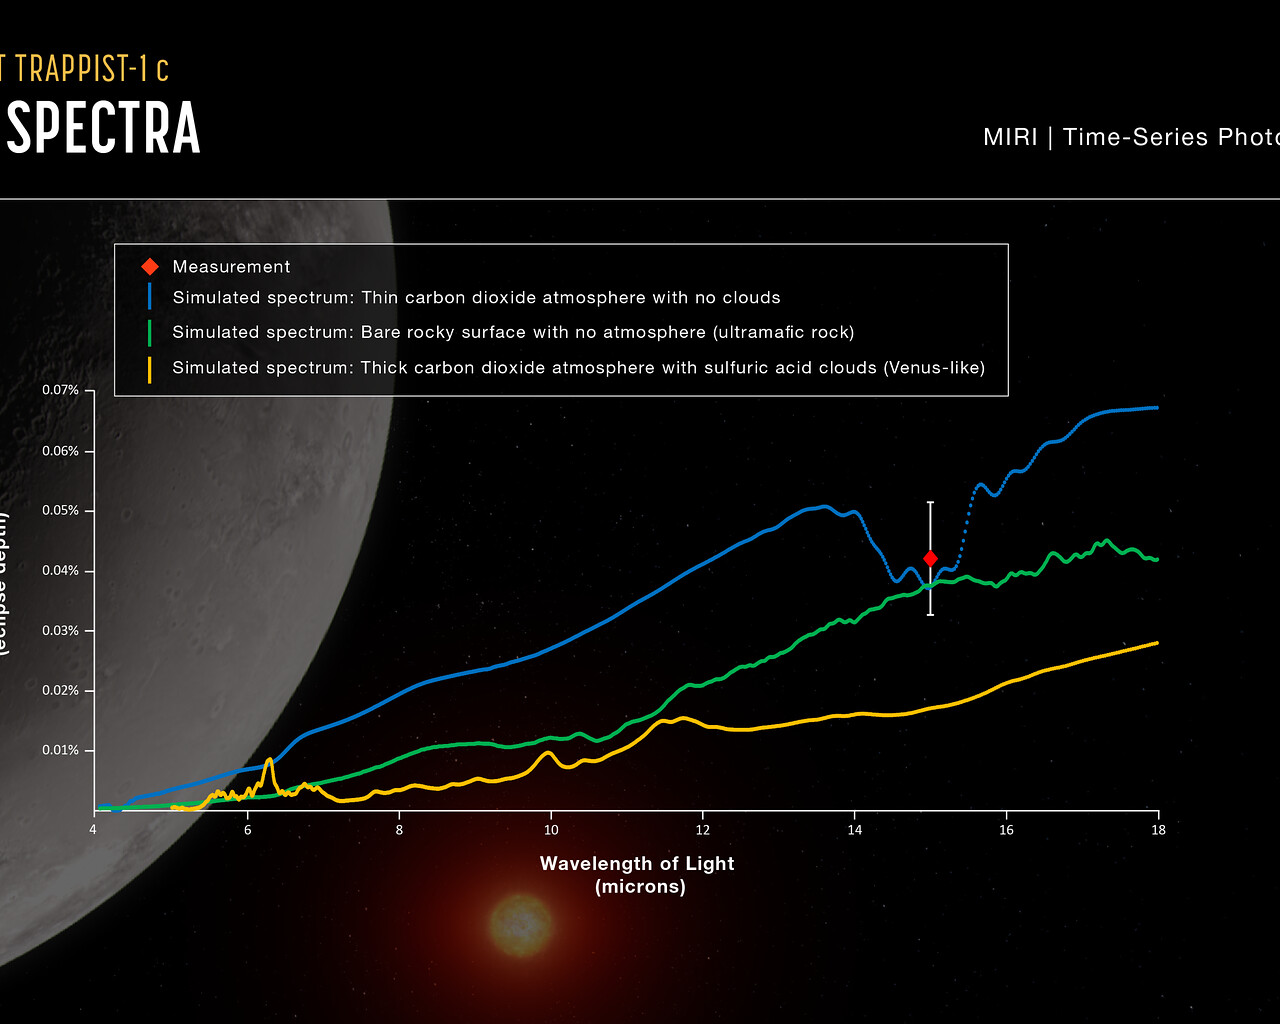
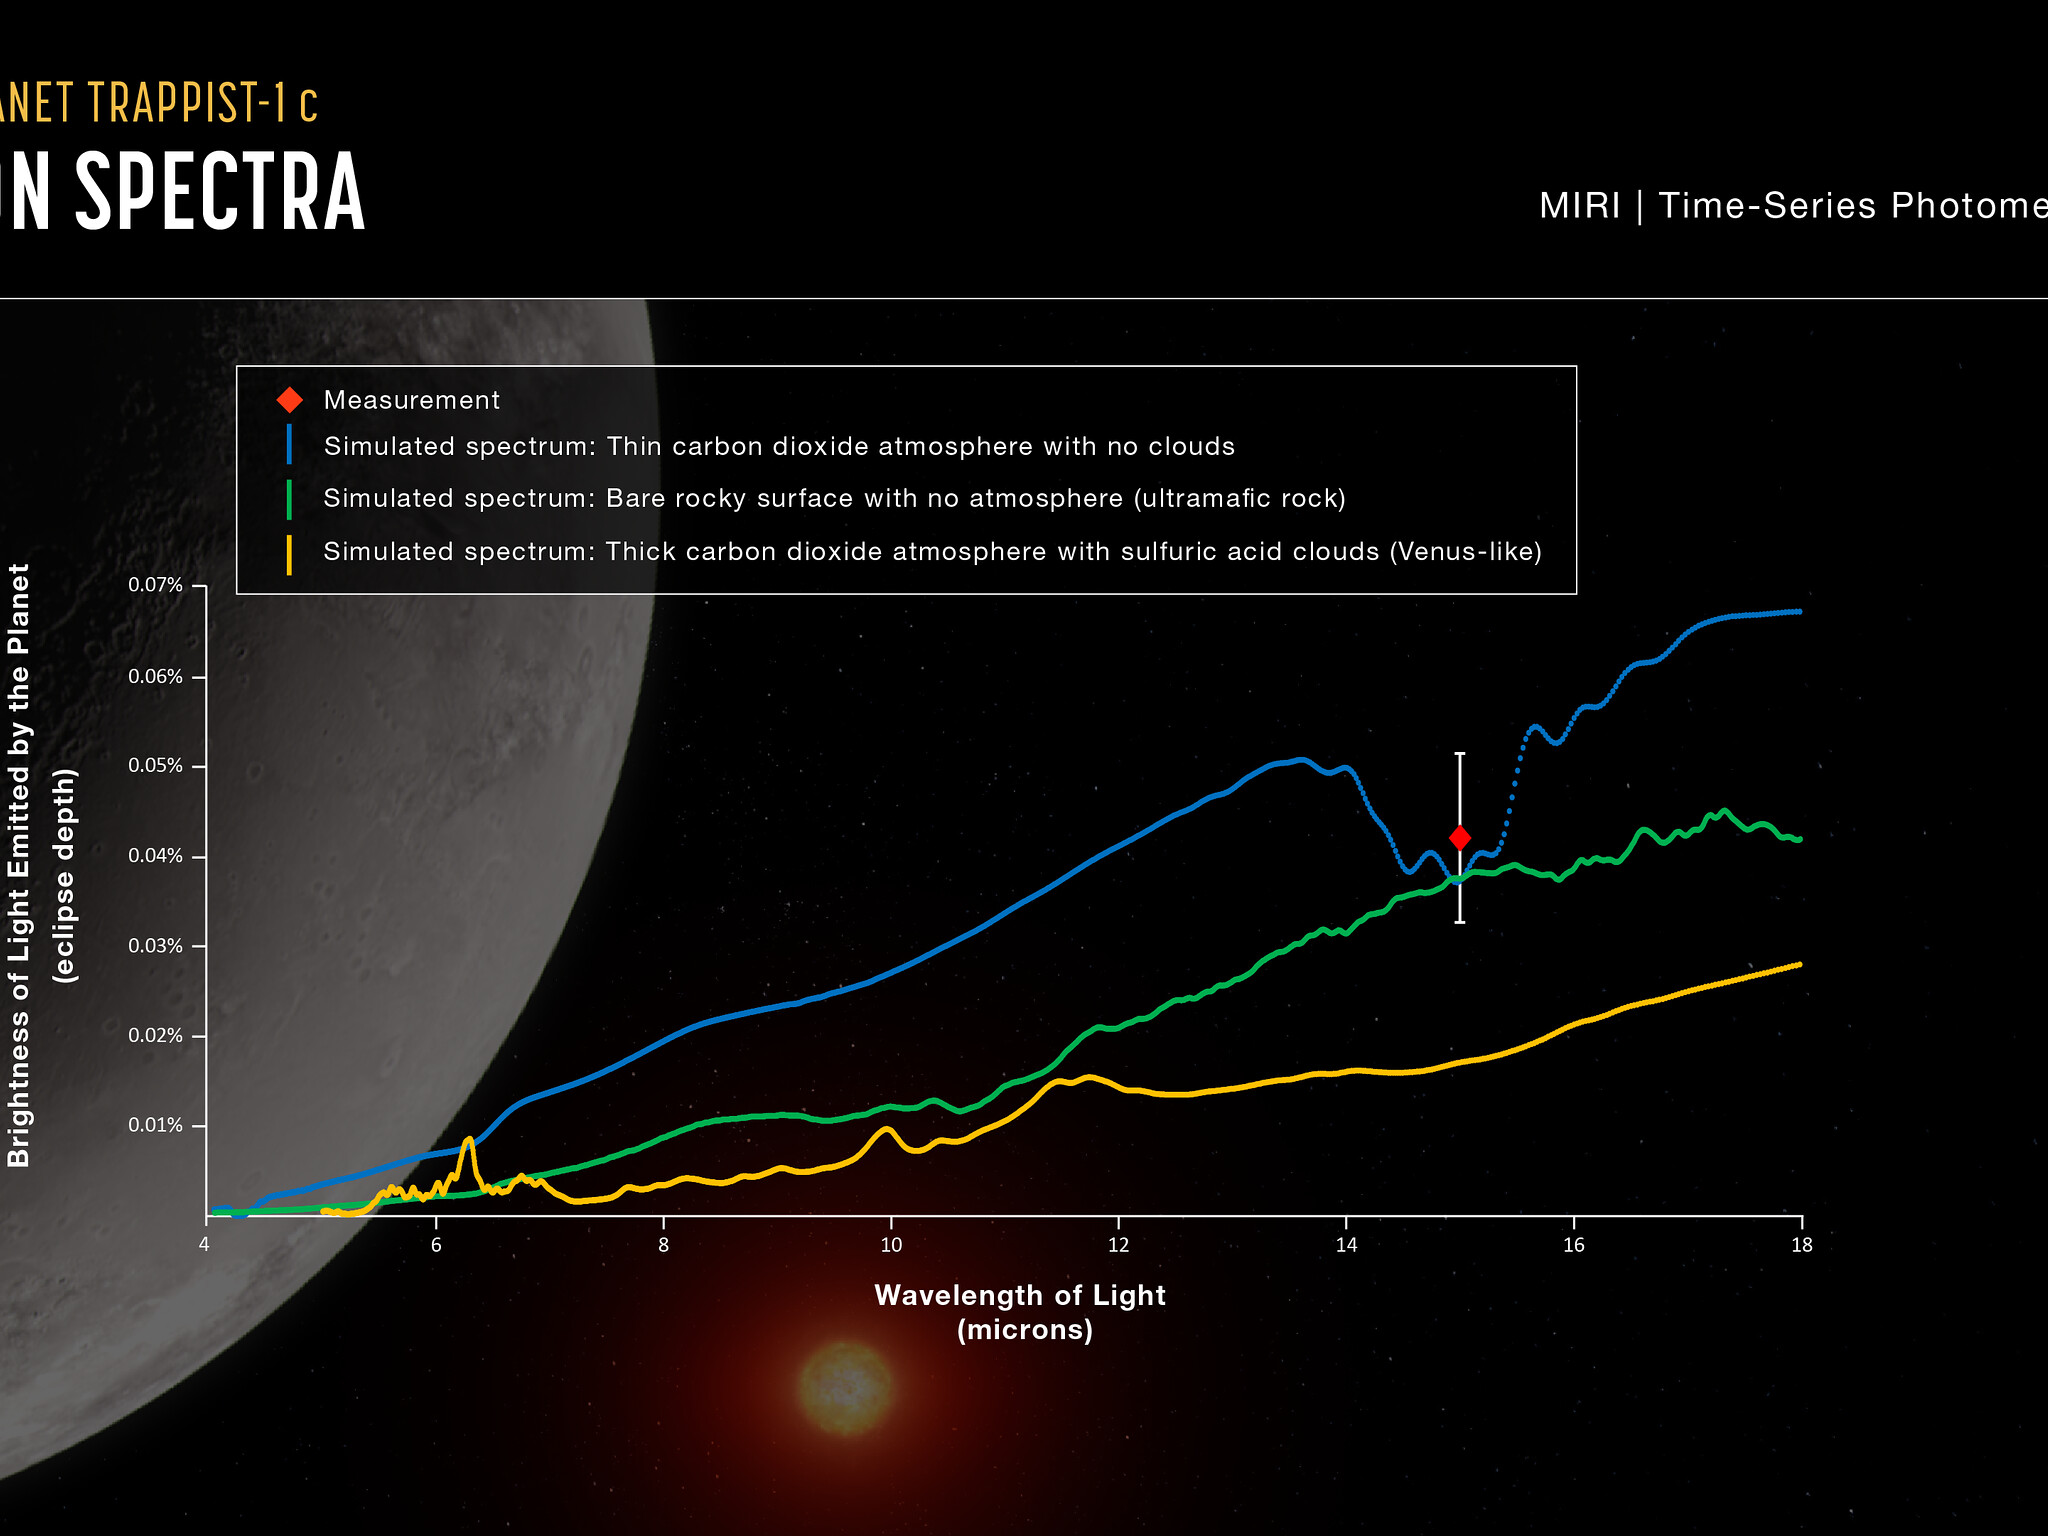
This graph compares the measured brightness of TRAPPIST-1 c to simulated brightness data for three different scenarios. The measurement (red diamond) is consistent with a bare rocky surface with no atmosphere (green line) or a very thin carbon dioxide atmosphere with no clouds (blue line). A thick carbon dioxide-rich atmosphere with sulphuric acid clouds, similar to that of Venus (yellow line), is unlikely.
The y-axis of the graph shows brightness (also called intensity or flux) of light in terms of eclipse depth, which is the difference between the combined brightness of the star and planet (when the planet is beside the star) and the brightness of the star on its own (when the planet is behind the star). Brightness increases from bottom to top on the graph: The greater the eclipse depth, the brighter the light from the planet. The x-axis shows the wavelength (or colour) of light being measured. All of the wavelengths shown here are in the infrared, which is invisible to human eyes.
The brightness of light emitted by the planet varies with wavelength: Some colours are brighter than others. The pattern of brightness (the spectrum) depends on factors such as the type of rock that makes up the surface, what the atmosphere is made of, and whether or not there are clouds. Different materials absorb and emit different amounts of different wavelengths of light.
The red diamond shows the brightness of TRAPPIST-1 c as measured using the F1500W filter on MIRI (Webb’s Mid-Infrared Instrument). The vertical lines extending above and below the diamond are error bars. The width of the blue box covers the range of wavelengths that were measured using MIRI’s F1500W filter, which allows light with wavelengths ranging from about 13.5 - 16.7 microns to pass through to the detectors.
The blue line shows what the emission spectrum of the planet’s dayside would look like assuming it has an oxygen atmosphere with 0.01% carbon dioxide, a surface pressure of 0.1 bars, and no clouds. (For reference, this is significantly thinner than Earth’s atmosphere, which is nitrogen- and oxygen-rich, with 0.04% carbon dioxide and a surface pressure of 1 bar.)
The green line shows what the emission spectrum of the planet’s dayside would be if it has no atmosphere and a rocky surface made of ultramafic rock. (Ultramafic rock is a type of igneous rock that is somewhat richer in iron and magnesium and poorer in silica than basalt, which makes up the crust beneath Earth’s oceans.)
The orange line shows the emission spectrum of the planet’s dayside if it had an atmosphere closer to that of Venus, with 96.5% carbon dioxide, a surface pressure of 10 bars, and sulphuric acid clouds.
[Image description: Graph showing the brightness of 15-micron light captured by Webb’s Mid Infrared Instrument plotted with three different simulated emission spectra, and an illustration of the planet and its star in the background.]
Credit:NASA, ESA, CSA, J. Olmsted (STScI), S. Zieba (MPI-A), L. Kreidberg (MPI-A)
About the Image
| Id: | trappist1c-2 | |
|---|---|---|
| Type: | Chart | |
| Release date: | 19 June 2023, 17:00 | |
| Size: | 3840 x 2161 px | |